santomax
New Member
- Joined
- Aug 27, 2022
- Messages
- 6
- Office Version
- 365
- 2021
- 2019
- 2016
- 2013
- 2011
- 2010
- 2007
- Platform
- Windows
Hi there
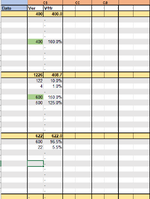
I have to get the average of the max of given data sets, skipping a yellow row in between. So for example Calculate the max of B4:B13 and the skip B14, to then calculate the max of B15:B24 and so on and so forth. to at the end average all of the max values calculated. I have been trying with array formulas and using MOD row functions, but I only make it work for single cell values, not for "data set" ranged to select the MAX (an example I made to calculate the average of every YELLOW row skipping 11 rows was =AVERAGE(IF(MOD(ROW(B:B)-ROW(B3),11)=0,IF(B:B<>"",B:B))).
Some help would be very appreciated!