Avg in Pivot Table

Alex501

Board Regular
Joined
Dec 11, 2015
Messages
54
Office Version
  1. 365
  2. 2019
Hi All

I need a bit of help and the answer is eluding me. I have a set of data which are calls reveived over a three month period for varying times of the day. I've added an additional column to work out the hour. So the data looks like this;
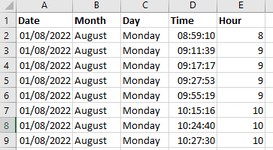
data.PNG

When I pivot the data I can count the total calls per hour for the set period, how do I go around averaging it per hour for each hour on each day;

total.PNG

Thanks in advance.
 

Excel Facts

Select all contiguous cells
Pressing Ctrl+* (asterisk) will select the "current region" - all contiguous cells in all directions.

Forum statistics

Threads
1,214,984
Messages
6,122,601
Members
449,089
Latest member
Motoracer88

We've detected that you are using an adblocker.

We have a great community of people providing Excel help here, but the hosting costs are enormous. You can help keep this site running by allowing ads on MrExcel.com.
Allow Ads at MrExcel

Which adblocker are you using?

Disable AdBlock

Follow these easy steps to disable AdBlock

1)Click on the icon in the browser’s toolbar.
2)Click on the icon in the browser’s toolbar.
2)Click on the "Pause on this site" option.
Go back

Disable AdBlock Plus

Follow these easy steps to disable AdBlock Plus

1)Click on the icon in the browser’s toolbar.
2)Click on the toggle to disable it for "mrexcel.com".
Go back

Disable uBlock Origin

Follow these easy steps to disable uBlock Origin

1)Click on the icon in the browser’s toolbar.
2)Click on the "Power" button.
3)Click on the "Refresh" button.
Go back

Disable uBlock

Follow these easy steps to disable uBlock

1)Click on the icon in the browser’s toolbar.
2)Click on the "Power" button.
3)Click on the "Refresh" button.
Go back
Back
Top