JenniferMurphy
Well-known Member
- Joined
- Jul 23, 2011
- Messages
- 2,532
- Office Version
- 365
- Platform
- Windows
I am working on a macro to generate a composite rating for products that are rated on multiple properties. I convert each separate rating to a z score. This puts them all on a common scale. (Mean = 0, Standard Deviation = 1.) I then add up the z scores.
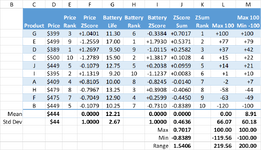
With z scores, it is a little difficult to get a good sense of the relative ratings. The table below has ratings for price and battery life. The corresponding z scores are in columns D & G. The sum of the z scores is in column I. Product D gets the top rating of 2.2812. In second place is Product I with a z score of 2.2556. But how much better is D than I.
My first thought was to "scale" the z scores so that the top score = 100 and the rest retain their relative value in proportion to that one. That is the contents of column K. That looks a lot better to me. We are used to rating things as percentages, so the 100 max looks good. Now we can see that D is less than 2 points better than I, but there is then is a gap of over 25 points to Product A in 3rd place.
I like that the z scores have a mean of zero. That says to me that the ones with a negative sore are less than average.
But I noticed that the lowest score is not -100. In some cases, it can be a lot lower. So my next thought was to scale it so that the top is 100 and the bottom is -200. That result is in column L.
I would appreciate any comments or suggestions. Thanks
| Weighted Ratings.xlsx | ||||||||||||||
|---|---|---|---|---|---|---|---|---|---|---|---|---|---|---|
| B | C | D | E | F | G | H | I | J | K | L | M | |||
| 5 | Product | Price | Price ZScore | Price Rank | Battery Life | Battery ZScore | Battery Rank | ZScore Sum | ZSum Rank | Max 100 | Max 100 Min -100 | |||
| 6 | D | $389 | +1.2697 | 1 | 9.50 | +1.0115 | 2 | +2.2812 | 1 | +100.00 | +100.00 | |||
| 7 | I | $395 | +1.1319 | 2 | 9.20 | +1.1237 | 1 | +2.2556 | 2 | +98.88 | +99.04 | |||
| 8 | A | $409 | +0.8105 | 4 | 10.00 | +0.8245 | 3 | +1.6350 | 3 | +71.67 | +75.75 | |||
| 9 | G | $399 | +1.0401 | 3 | 11.30 | +0.3384 | 5 | +1.3785 | 4 | +60.43 | +66.13 | |||
| 10 | B | $449 | -0.1079 | 5 | 10.25 | +0.7310 | 4 | +0.6231 | 5 | +27.32 | +37.78 | |||
| 11 | J | $449 | -0.1079 | 5 | 12.75 | -0.2038 | 6 | -0.3117 | 6 | -13.66 | +2.71 | |||
| 12 | F | $475 | -0.7049 | 7 | 12.90 | -0.2599 | 7 | -0.9648 | 7 | -42.29 | -21.80 | |||
| 13 | H | $479 | -0.7967 | 8 | 13.25 | -0.3908 | 8 | -1.1875 | 8 | -52.06 | -30.15 | |||
| 14 | C | $500 | -1.2789 | 10 | 15.90 | -1.3817 | 9 | -2.6606 | 9 | -116.63 | -85.43 | |||
| 15 | E | $499 | -1.2559 | 9 | 17.00 | -1.7930 | 10 | -3.0489 | 10 | -133.66 | -100.00 | |||
| 16 | Mean | $444 | 0.0000 | 12.21 | 0.0000 | 0.0000 | 0.00 | 14.40 | ||||||
| 17 | Std Dev | $44 | 1.0000 | 2.67 | 1.0000 | 1.9455 | 85.29 | 73.00 | ||||||
| 18 | Max | Max | 2.2812 | |||||||||||
| 19 | Min | Min | -3.0489 | |||||||||||
| 20 | Range | Range | 5.3301 | |||||||||||
Scaling | ||||||||||||||
| Cell Formulas | ||
|---|---|---|
| Range | Formula | |
| E6:E15 | E6 | =-([@Price]-TblScalings[[#Totals],[Price]])/PriceStdDev |
| F6:F15 | F6 | =RANK.EQ([@[Price ZScore]],[Price ZScore]) |
| H6:H15 | H6 | =-([@[Battery Life]]-TblScalings[[#Totals],[Battery Life]])/BattStdDev |
| I6:I15 | I6 | =RANK.EQ([@[Battery ZScore]],[Battery ZScore]) |
| L6:L15 | L6 | =[@[ZScore Sum]]/ZSumMax*100 |
| M6:M15 | M6 | =(([@[ZScore Sum]]-ZSumMin)/(ZSumRange)*200)-100 |
| L16 | L16 | =SUBTOTAL(101,[Max 100]) |
| M16 | M16 | =SUBTOTAL(101,[Max 100 Min -100]) |
| L17 | L17 | =STDEV.S(TblScalings[Max 100]) |
| M17 | M17 | =STDEV.S(TblScalings[Max 100 Min -100]) |
| K6:K15 | K6 | =RANK.EQ([@[ZScore Sum]],[ZScore Sum]) |
| D16 | D16 | =SUBTOTAL(101,[Price]) |
| E16 | E16 | =SUBTOTAL(101,[Price ZScore]) |
| D17 | D17 | =STDEV.S(TblScalings[Price]) |
| E17 | E17 | =STDEV.S(TblScalings[Price ZScore]) |
| G16 | G16 | =SUBTOTAL(101,[Battery Life]) |
| H16 | H16 | =SUBTOTAL(101,[Battery ZScore]) |
| G17 | G17 | =STDEV.S(TblScalings[Battery Life]) |
| H17 | H17 | =STDEV.S(TblScalings[Battery ZScore]) |
| J6:J15 | J6 | =[@[Price ZScore]]+[@[Battery ZScore]] |
| J16 | J16 | =SUBTOTAL(101,[ZScore Sum]) |
| J17 | J17 | =STDEV.S(TblScalings[ZScore Sum]) |
| J18 | J18 | =MAX(TblScalings[ZScore Sum]) |
| J19 | J19 | =MIN(TblScalings[ZScore Sum]) |
| J20 | J20 | =J18-J19 |
| Named Ranges | ||
|---|---|---|
| Name | Refers To | Cells |
| BattStdDev | =Scaling!$G$17 | H6:H15 |
| PriceStdDev | =Scaling!$D$17 | E6:E15 |
| ZSumMax | =Scaling!$J$18 | J20, L6:L15 |
| ZSumMin | =Scaling!$J$19 | J20, M6:M15 |
| ZSumRange | =Scaling!$J$20 | M6:M15 |