Binding Chart, not matching cell values (VBA)

KillGorack

New Member
Joined
Jan 23, 2006
Messages
35
Office Version
  1. 2016
Platform
  1. Windows
I have some VBA to bind chart data

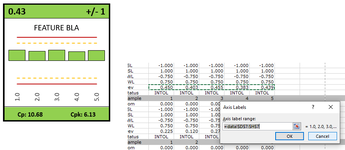
But the x axis names of each series, and their X-Axis Labels arent matching what is bound.

Image shows the bound area, and the values it comes up with.. no match!

Any ideas?

VBA Below
VBA Code:
                ' Nominal Line
                With ThisWorkbook.Sheets(sht).ChartObjects("trend_" & shp).Chart.FullSeriesCollection(1)
                    .Name = "Nominal"
                    .Values = "=data!$D$" & dataLocation + 1 & ":$" & DataWidthLetter & "$" & dataLocation + 1
                    .XValues = "=data!$D$" & dataLocation + 6 & ":$" & DataWidthLetter & "$" & dataLocation + 6
                    .XValues = "=data!$D$" & dataLocation + 6 & ":$" & DataWidthLetter & "$" & dataLocation + 6
                    .Format.Line.Visible = msoTrue
                    .Format.Line.Weight = 0.25
                End With
                With ThisWorkbook.Sheets(sht).ChartObjects("trend_" & shp).Chart.FullSeriesCollection(1)
                    .Format.Line.Visible = msoTrue
                    .Format.Line.Weight = 0.25
                    .Format.Line.Visible = msoTrue
                    .Format.Line.ForeColor.RGB = RGB(0, 0, 0)
                    .Format.Line.Transparency = 0
                End With
                
                'Deviations.
                With ThisWorkbook.Sheets(sht).ChartObjects("trend_" & shp).Chart.FullSeriesCollection(2)
                    .Name = "Deviations"
                    .Values = "=data!$D$" & dataLocation + 6 & ":$" & DataWidthLetter & "$" & dataLocation + 6
                    .XValues = "=data!$D$" & dataLocation + 6 & ":$" & DataWidthLetter & "$" & dataLocation + 6
                    .Format.Line.Visible = msoTrue
                    .Format.Line.ForeColor.RGB = RGB(0, 0, 0)
                    .Format.Line.Weight = 0.25
                End With
                With ThisWorkbook.Sheets(sht).ChartObjects("trend_" & shp).Chart.FullSeriesCollection(2)
                    .Format.Line.Visible = msoTrue
                    .Format.Line.ForeColor.RGB = RGB(0, 0, 0)
                    .Format.Line.Weight = 0.25
                End With
 

Attachments

  • what the what.PNG
    what the what.PNG
    95 KB · Views: 8

Excel Facts

Get help while writing formula
Click the italics "fx" icon to the left of the formula bar to open the Functions Arguments dialog. Help is displayed for each argument.
Gah! I found it.. it was a corrupt chart that lost its data that I was replicating into new areas.

Rebuilt the chart and they start working.
 
Upvote 0

Forum statistics

Threads
1,215,330
Messages
6,124,305
Members
449,150
Latest member
NyDarR

We've detected that you are using an adblocker.

We have a great community of people providing Excel help here, but the hosting costs are enormous. You can help keep this site running by allowing ads on MrExcel.com.
Allow Ads at MrExcel

Which adblocker are you using?

Disable AdBlock

Follow these easy steps to disable AdBlock

1)Click on the icon in the browser’s toolbar.
2)Click on the icon in the browser’s toolbar.
2)Click on the "Pause on this site" option.
Go back

Disable AdBlock Plus

Follow these easy steps to disable AdBlock Plus

1)Click on the icon in the browser’s toolbar.
2)Click on the toggle to disable it for "mrexcel.com".
Go back

Disable uBlock Origin

Follow these easy steps to disable uBlock Origin

1)Click on the icon in the browser’s toolbar.
2)Click on the "Power" button.
3)Click on the "Refresh" button.
Go back

Disable uBlock

Follow these easy steps to disable uBlock

1)Click on the icon in the browser’s toolbar.
2)Click on the "Power" button.
3)Click on the "Refresh" button.
Go back
Back
Top