Cannot make a simple 100% stacked bar chart

RockandGrohl

Well-known Member
Joined
Aug 1, 2018
Messages
790
Office Version
  1. 365
Platform
  1. Windows
Starting to think PowerBI isn't all it's cracked up to be.

I have a data table which contains a summary of my company's projects by ID.

The additional columns then summarise each of the category of costs.

Please see below table as an example:

Project IDTotal CostsStage 1Stage 2Stage 3Stage 4
12345£1,000,000£100,000£400,000,000£250,000£250,000
12242£800,000£300,000£200,000£100,000£200,000

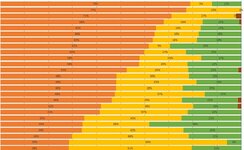
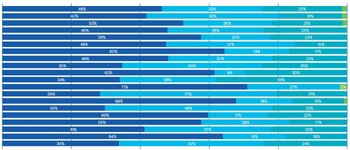
I'm simply trying to create a stacked bar chart which looks similar to this:

But no matter which fields I select for X-Axis, Y-axis, Legend, I cannot get any kind of bar chart to show up. When I drag the relevant columns over, nothing happens, it does not allow me to drop the stage columns in to display as fields.


The values in the data table columns are formatted as currency.
 

Attachments

  • stacked bar.JPG
    stacked bar.JPG
    103.8 KB · Views: 4

Excel Facts

Create a chart in one keystroke
Select the data and press Alt+F1 to insert a default chart. You can change the default chart to any chart type
Works fine here just adding the 4 stages as X-axis fields and the project ID as Y-axis.
 
Upvote 0
Works fine here just adding the 4 stages as X-axis fields and the project ID as Y-axis.
When I put the Y-axis as "Project ID", I am unable to drag anything in to the X-axis.


Let me explain a bit more as I may have missed something out.

My main table is called Database. It contains thousands of rows, so for example probably 40 rows for project 12345, and 32 rows for project 12242, etc.

There's a column called Cost Heading and this is what I'm using to categorise the four stages. But there's more than 4 types of values, so Stage 1 = Stage 1, Stage 3 = Stage 3, Stage 4 = Stage 4, but everything else is categorised as "Stage 2"


Because of this, I've created a new table - CostBreakdown

This table has one line per project ID, and the costs broken down using calculated columns, exactly as in the example table above.

However, I am totally unable to drag any fields into the X-axis. Whether it's a calculated column, or a measure, I drag & drop and nothing happens and the field input stays blank.

Is there any way I can screen share to you, would rather not paste my project publicly on the Internet. Thanks.
 
Upvote 0
Is there any way I can screen share to you
No, there isn't.

I just copied and pasted your data from above into a table, and then loaded it into PBI and dropped the fields into a visual, with no problems. Can you not produce an anonymised sample to share?
 
Upvote 0
No, there isn't.

I just copied and pasted your data from above into a table, and then loaded it into PBI and dropped the fields into a visual, with no problems. Can you not produce an anonymised sample to share?
I'm not sure why my data is different.

It's on a new table, as above.

Can I privately send you the file after I've anonymised it?
 
Upvote 0
Why does it need to be private if it's been anonymised?
 
Upvote 0
I have this, how do I now sort by the legend? I'd like the dark blue series to show the largest percentage first, and then roll down through to the smallest percentages last. Thank you.
 

Attachments

  • pbi chart.JPG
    pbi chart.JPG
    198 KB · Views: 2
Upvote 0
Change the order of the fields on the axis?
 
Upvote 0
Change the order of the fields on the axis?
The only way I could get it to work is as follows:

Y-axis = Project ID
X-axis = Stage Cost (DAX - Stage Cost = SUMX(Database,Database[Cost (Inflation)])
Legend = "Construction Stages" grouped values, where I manually grouped the items I require into each Group.

Now that the chart is properly showing all my stages in order (Stage 1, Stage 2, Stage 3, Stage 4), I just need it to sort the values within Stage 1 from largest to smallest. That's my next challenge.
 
Upvote 0

Forum statistics

Threads
1,215,069
Messages
6,122,956
Members
449,096
Latest member
Anshu121

We've detected that you are using an adblocker.

We have a great community of people providing Excel help here, but the hosting costs are enormous. You can help keep this site running by allowing ads on MrExcel.com.
Allow Ads at MrExcel

Which adblocker are you using?

Disable AdBlock

Follow these easy steps to disable AdBlock

1)Click on the icon in the browser’s toolbar.
2)Click on the icon in the browser’s toolbar.
2)Click on the "Pause on this site" option.
Go back

Disable AdBlock Plus

Follow these easy steps to disable AdBlock Plus

1)Click on the icon in the browser’s toolbar.
2)Click on the toggle to disable it for "mrexcel.com".
Go back

Disable uBlock Origin

Follow these easy steps to disable uBlock Origin

1)Click on the icon in the browser’s toolbar.
2)Click on the "Power" button.
3)Click on the "Refresh" button.
Go back

Disable uBlock

Follow these easy steps to disable uBlock

1)Click on the icon in the browser’s toolbar.
2)Click on the "Power" button.
3)Click on the "Refresh" button.
Go back
Back
Top