indiemusicboy
New Member
- Joined
- Apr 9, 2020
- Messages
- 47
- Office Version
- 365
- Platform
- MacOS
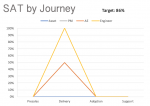
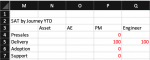
Hello! I have a Chart problem. I'm trying to show the data in Fig A in a line chart in Fig B. I'm using 2-D Line 100% Stacked chart.
But as you can see the numbers from Fig A are not matching the legend, colors, nor numbers in Fig B.
Fig C is my chart data input.
What gives?
Is my data messed up or is my use of the chart incorrect?
Fig A

Fig B

Fig C

But as you can see the numbers from Fig A are not matching the legend, colors, nor numbers in Fig B.
Fig C is my chart data input.
What gives?
Is my data messed up or is my use of the chart incorrect?
Fig A
Fig B
Fig C