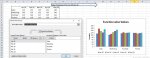
Chart for Horizontally Progressing Dynamic Data

meami111

New Member
Joined
Dec 1, 2010
Messages
36
Hello, I have a data set which progresses horizontally. Please suggest how to create a dynamic chart for the same. I am unable to include a named range in the Series (Legends) side but have done for horizontal axis. Please check the attached chart
 

Attachments

  • Dynamic Chart.JPG
    Dynamic Chart.JPG
    97 KB · Views: 9

Excel Facts

What did Pito Salas invent?
Pito Salas, working for Lotus, popularized what would become to be pivot tables. It was released as Lotus Improv in 1989.
Hi

The easiest way to do this is to hide columns.

Create a table with all 12 months as shown below and graph it.

1585397170268.png


Then hide the columns that you do not want to graph. It is illustrated below.


1585397252075.png


Kind regards

Saba
 
Upvote 0

Forum statistics

Threads
1,215,484
Messages
6,125,066
Members
449,206
Latest member
Healthydogs

We've detected that you are using an adblocker.

We have a great community of people providing Excel help here, but the hosting costs are enormous. You can help keep this site running by allowing ads on MrExcel.com.
Allow Ads at MrExcel

Which adblocker are you using?

Disable AdBlock

Follow these easy steps to disable AdBlock

1)Click on the icon in the browser’s toolbar.
2)Click on the icon in the browser’s toolbar.
2)Click on the "Pause on this site" option.
Go back

Disable AdBlock Plus

Follow these easy steps to disable AdBlock Plus

1)Click on the icon in the browser’s toolbar.
2)Click on the toggle to disable it for "mrexcel.com".
Go back

Disable uBlock Origin

Follow these easy steps to disable uBlock Origin

1)Click on the icon in the browser’s toolbar.
2)Click on the "Power" button.
3)Click on the "Refresh" button.
Go back

Disable uBlock

Follow these easy steps to disable uBlock

1)Click on the icon in the browser’s toolbar.
2)Click on the "Power" button.
3)Click on the "Refresh" button.
Go back
Back
Top