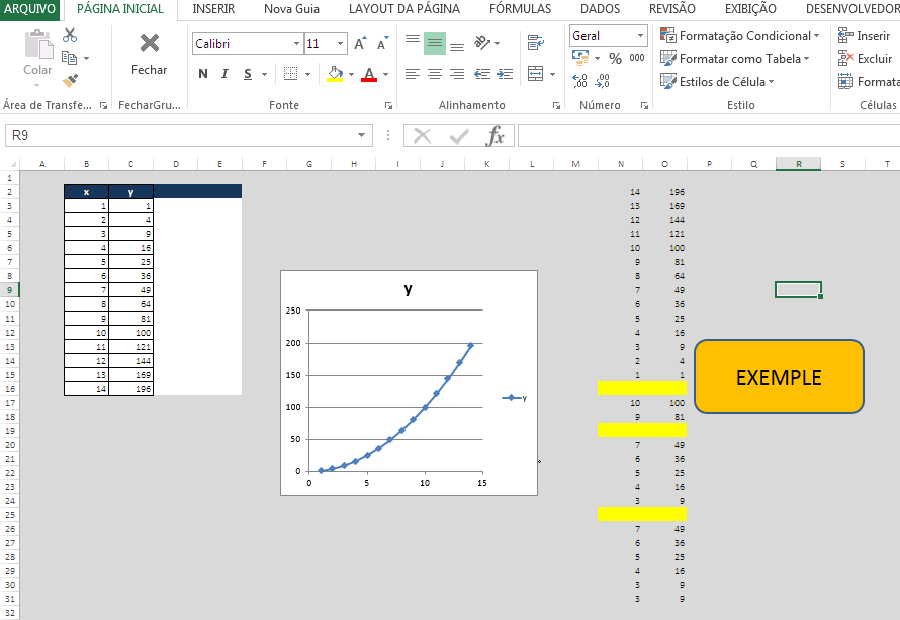
chart MouseOver grabbing Pòints to Range

doriangrey

Board Regular
Joined
Jan 18, 2012
Messages
57
Hi Partners,

i want grab All Points on MouseOver of embeded Chart to new Range columns X,Y on MouseOver event and other approach option on standard module.

i want get the All Points of chart on MouseOver without click on point, and Not all point of series.

like Array of Points on MouseMove and put on range of cells 2 columns x y .

vba routine please.

thanks!


not solution here
https://www.excelforum.com/excel-charting-and-pivots/1180645-chart-mouseover-grabbing-points-to-range.html
 
The following code may need to be amended, depending on your actual requirements. The co-ordinates are placed in Column N and Column O, starting at Row 2. It's set up to move over to Column Q and Column R after 20 rows of data, and so on. Of course, this can be changed as desired.

Code:
[COLOR=darkblue]Public[/COLOR] [COLOR=darkblue]WithEvents[/COLOR] target [COLOR=darkblue]As[/COLOR] Chart

[COLOR=darkblue]Private[/COLOR] [COLOR=darkblue]Sub[/COLOR] target_MouseMove([COLOR=darkblue]ByVal[/COLOR] Button [COLOR=darkblue]As[/COLOR] [COLOR=darkblue]Long[/COLOR], [COLOR=darkblue]ByVal[/COLOR] Shift [COLOR=darkblue]As[/COLOR] [COLOR=darkblue]Long[/COLOR], [COLOR=darkblue]ByVal[/COLOR] x [COLOR=darkblue]As[/COLOR] [COLOR=darkblue]Long[/COLOR], [COLOR=darkblue]ByVal[/COLOR] y [COLOR=darkblue]As[/COLOR] [COLOR=darkblue]Long[/COLOR])

    [COLOR=darkblue]Dim[/COLOR] XVals [COLOR=darkblue]As[/COLOR] [COLOR=darkblue]Variant[/COLOR]
    [COLOR=darkblue]Dim[/COLOR] Vals [COLOR=darkblue]As[/COLOR] [COLOR=darkblue]Variant[/COLOR]
    [COLOR=darkblue]Dim[/COLOR] ElementID [COLOR=darkblue]As[/COLOR] [COLOR=darkblue]Long[/COLOR]
    [COLOR=darkblue]Dim[/COLOR] Arg1 [COLOR=darkblue]As[/COLOR] [COLOR=darkblue]Long[/COLOR]
    [COLOR=darkblue]Dim[/COLOR] Arg2 [COLOR=darkblue]As[/COLOR] [COLOR=darkblue]Long[/COLOR]
    
    [COLOR=darkblue]Static[/COLOR] PrevPoint [COLOR=darkblue]As[/COLOR] [COLOR=darkblue]Long[/COLOR]
    [COLOR=darkblue]Static[/COLOR] r [COLOR=darkblue]As[/COLOR] [COLOR=darkblue]Long[/COLOR]
    [COLOR=darkblue]Static[/COLOR] c [COLOR=darkblue]As[/COLOR] [COLOR=darkblue]Long[/COLOR]
    
    target.GetChartElement x, y, ElementID, Arg1, Arg2
    
    [COLOR=darkblue]If[/COLOR] ElementID = xlSeries [COLOR=darkblue]Then[/COLOR]
        [COLOR=darkblue]If[/COLOR] Arg2 <> PrevPoint [COLOR=darkblue]Then[/COLOR]
            XVals = target.SeriesCollection(Arg1).XValues
            Vals = target.SeriesCollection(Arg1).Values
            r = r + 1
            Range("N2").Cells(r, c + 1).Value = XVals(Arg2)
            Range("O2").Cells(r, c + 1).Value = Vals(Arg2)
            [COLOR=darkblue]If[/COLOR] r = 20 [COLOR=darkblue]Then[/COLOR]
                r = 0
                c = c + 3
            [COLOR=darkblue]End[/COLOR] [COLOR=darkblue]If[/COLOR]
            PrevPoint = Arg2
        [COLOR=darkblue]End[/COLOR] [COLOR=darkblue]If[/COLOR]
    [COLOR=darkblue]End[/COLOR] [COLOR=darkblue]If[/COLOR]
    
[COLOR=darkblue]End[/COLOR] [COLOR=darkblue]Sub[/COLOR]

Hope this helps!
 
Upvote 0

Excel Facts

Remove leading & trailing spaces
Save as CSV to remove all leading and trailing spaces. It is faster than using TRIM().
Hi, Domenic,

You are Geate! Thank you Verey Very Mutch!
you code works perfect !
we make History, no one has done this before !
No one has done this before.

Can you help me improve a little?
I wish I could interrupt the colect with key "Esc" or when the mouse exits outside the Area of Chart.
Continue collecting the coordinates not in another column but in the same column by skipping a cell and coloring the skipped cell with yellow or any color.


my FullCode

classModule "ClassEvent"

Code:
Option Explicit
Public WithEvents Graph As Chart


Public WithEvents target As Chart
Private Sub target_MouseMove( _
        ByVal Button As Long, _
        ByVal Shift As Long, _
        ByVal x As Long, _
        ByVal y As Long _
    )
    
    ActiveSheet.ChartObjects(1).Activate
    
    Dim ElemID As Long, Arg1 As Long, Arg2 As Long
    Call ActiveChart.GetChartElement(x, y, _
            ElemID, _
            Arg1, _
            Arg2 _
     )


    Dim xvalue As Double
    Dim value As Double
    Dim clickedSeriesXValues, clickedSeriesValues As Variant
    Select Case ElemID
        Case xlSeries
            clickedSeriesXValues = ActiveChart.SeriesCollection(Arg1).XValues
            clickedSeriesValues = ActiveChart.SeriesCollection(Arg1).Values
              
            xvalue = clickedSeriesXValues(Arg2)
            value = clickedSeriesValues(Arg2)
           
            ''' xvalue = ActiveChart.SeriesCollection(Arg1).XValues(Arg2)
            ''' value = ActiveChart.SeriesCollection(Arg1).Values(Arg2)
            
            'Call MsgBox(xvalue & " " & value)
''=============================================================
   Dim ColunaY As Range
   Set ColunaY = Range("J2:J5")
   Dim cel As Range
   
For Each cel In ColunaY
    Dim IVALUE As Long
 
    IVALUE = IVALUE + 1
      
      Dim FirstCelXi As Range
      Dim CelX1 As Range
      Dim CelY1 As Range
      
Set FirstCelXi = ActiveSheet.Range("J2")


Set CelX1 = ActiveSheet.Range("J2").Resize(IVALUE, 2)


Next cel


If Len(FirstCelXi.value) = 0 Then


        CelX1.value = Array(xvalue, value)


Else
        
End If
''=================================================================
''=================================================================
    Dim XVals As Variant
    Dim Vals As Variant
    Dim ElementID As Long
    'Dim Arg1 As Long
    'Dim Arg2 As Long
    
    Static PrevPoint As Long
    Static r As Long
    Static c As Long
    
    target.GetChartElement x, y, ElementID, Arg1, Arg2
    
    If ElementID = xlSeries Then
        If Arg2 <> PrevPoint Then
            XVals = target.SeriesCollection(Arg1).XValues
            Vals = target.SeriesCollection(Arg1).Values
            r = r + 1
            Range("N2").Cells(r, c + 1).value = XVals(Arg2)
            Range("O2").Cells(r, c + 1).value = Vals(Arg2)
            If r = 20 Then
                r = 0
                c = c + 3
            End If
            PrevPoint = Arg2
        End If
    End If
''=================================================================
''=================================================================
        Case Else
     
    End Select
    
End Sub

Module1

Code:
Private ce As New ChartEvent


Sub SetCurrentChart()


    Dim c As Chart
    Set c = ActiveSheet.ChartObjects(1).Chart


    Call setChart(c)


End Sub
Public Sub setChart(ByVal c As Chart)
    Set ce.target = c
End Sub


Module ThisWorkbook
Code:
Option Explicit


Private Sub Workbook_Open()
  Call SetCurrentChart
End Sub

https://s-media-cache-ak0.pinimg.com/originals/18/09/2c/18092cf8659d42e12696be531806d3cb.png

18092cf8659d42e12696be531806d3cb.png
 
Upvote 0
Has not in all Internet web information about this: collect individual point of chart to differents cell in range. I want looks like the screenshot in previous reply.
 
Upvote 0
With the following code, whenever the chart is activated or the cursor moves over the chart area, not the plot area, it's ready to start a new collection. You can stop the collection by de-selecting the chart. You can do this by selecting a cell outside the chart or pressing the Esc key. Note, though, if the plot area is selected when pressing the Esc key, you'll have press once to de-select the plot area, and again to de-select the chart.

Code:
[COLOR=darkblue]Option[/COLOR] [COLOR=darkblue]Explicit[/COLOR]

[COLOR=darkblue]Public[/COLOR] [COLOR=darkblue]WithEvents[/COLOR] target [COLOR=darkblue]As[/COLOR] Chart

[COLOR=darkblue]Dim[/COLOR] PrevPoint [COLOR=darkblue]As[/COLOR] [COLOR=darkblue]Long[/COLOR]
[COLOR=darkblue]Dim[/COLOR] bNew [COLOR=darkblue]As[/COLOR] [COLOR=darkblue]Boolean[/COLOR]

[COLOR=darkblue]Private[/COLOR] [COLOR=darkblue]Sub[/COLOR] target_Activate()
    PrevPoint = 0
    bNew = [COLOR=darkblue]True[/COLOR]
[COLOR=darkblue]End[/COLOR] [COLOR=darkblue]Sub[/COLOR]

[COLOR=darkblue]Private[/COLOR] [COLOR=darkblue]Sub[/COLOR] target_MouseMove([COLOR=darkblue]ByVal[/COLOR] Button [COLOR=darkblue]As[/COLOR] [COLOR=darkblue]Long[/COLOR], [COLOR=darkblue]ByVal[/COLOR] Shift [COLOR=darkblue]As[/COLOR] [COLOR=darkblue]Long[/COLOR], [COLOR=darkblue]ByVal[/COLOR] x [COLOR=darkblue]As[/COLOR] [COLOR=darkblue]Long[/COLOR], [COLOR=darkblue]ByVal[/COLOR] y [COLOR=darkblue]As[/COLOR] [COLOR=darkblue]Long[/COLOR])

    [COLOR=darkblue]Dim[/COLOR] XVals [COLOR=darkblue]As[/COLOR] [COLOR=darkblue]Variant[/COLOR]
    [COLOR=darkblue]Dim[/COLOR] Vals [COLOR=darkblue]As[/COLOR] [COLOR=darkblue]Variant[/COLOR]
    [COLOR=darkblue]Dim[/COLOR] ElementID [COLOR=darkblue]As[/COLOR] [COLOR=darkblue]Long[/COLOR]
    [COLOR=darkblue]Dim[/COLOR] Arg1 [COLOR=darkblue]As[/COLOR] [COLOR=darkblue]Long[/COLOR]
    [COLOR=darkblue]Dim[/COLOR] Arg2 [COLOR=darkblue]As[/COLOR] [COLOR=darkblue]Long[/COLOR]
    
    [COLOR=darkblue]Static[/COLOR] CurrRow [COLOR=darkblue]As[/COLOR] [COLOR=darkblue]Long[/COLOR]
    
    target.GetChartElement x, y, ElementID, Arg1, Arg2
    
    [COLOR=darkblue]Select[/COLOR] [COLOR=darkblue]Case[/COLOR] ElementID
        [COLOR=darkblue]Case[/COLOR] xlChartArea
            PrevPoint = 0
            bNew = [COLOR=darkblue]True[/COLOR]
        [COLOR=darkblue]Case[/COLOR] xlSeries
            [COLOR=darkblue]If[/COLOR] bNew [COLOR=darkblue]Then[/COLOR]
                [COLOR=darkblue]If[/COLOR] CurrRow > 0 [COLOR=darkblue]Then[/COLOR]
                    CurrRow = CurrRow + 1
                    Cells(CurrRow + 1, "N").Resize(, 2).Interior.Color = vbYellow
                [COLOR=darkblue]End[/COLOR] [COLOR=darkblue]If[/COLOR]
                bNew = [COLOR=darkblue]False[/COLOR]
            [COLOR=darkblue]End[/COLOR] [COLOR=darkblue]If[/COLOR]
            [COLOR=darkblue]If[/COLOR] Arg2 <> PrevPoint [COLOR=darkblue]Then[/COLOR]
                XVals = target.SeriesCollection(Arg1).XValues
                Vals = target.SeriesCollection(Arg1).Values
                CurrRow = CurrRow + 1
                Cells(CurrRow + 1, "N").Value = XVals(Arg2)
                Cells(CurrRow + 1, "O").Value = Vals(Arg2)
                PrevPoint = Arg2
            [COLOR=darkblue]End[/COLOR] [COLOR=darkblue]If[/COLOR]
    [COLOR=darkblue]End[/COLOR] [COLOR=darkblue]Select[/COLOR]
    
[COLOR=darkblue]End[/COLOR] [COLOR=darkblue]Sub[/COLOR]

Hope this helps!
 
Last edited:
Upvote 0
Actually, if you want to stop the collection only when the chart is de-selected, whether by using the Esc key or selecting a cell outside the chart, try the following instead...

Code:
[color=darkblue]Option[/color] [color=darkblue]Explicit[/color]

[color=darkblue]Public[/color] [color=darkblue]WithEvents[/color] target [color=darkblue]As[/color] Chart

[color=darkblue]Dim[/color] PrevPoint [color=darkblue]As[/color] [color=darkblue]Long[/color]
[color=darkblue]Dim[/color] bNew [color=darkblue]As[/color] [color=darkblue]Boolean[/color]

[color=darkblue]Private[/color] [color=darkblue]Sub[/color] target_Activate()
    PrevPoint = 0
    bNew = [color=darkblue]True[/color]
[color=darkblue]End[/color] [color=darkblue]Sub[/color]

[color=darkblue]Private[/color] [color=darkblue]Sub[/color] target_MouseMove([color=darkblue]ByVal[/color] Button [color=darkblue]As[/color] [color=darkblue]Long[/color], [color=darkblue]ByVal[/color] Shift [color=darkblue]As[/color] [color=darkblue]Long[/color], [color=darkblue]ByVal[/color] x [color=darkblue]As[/color] [color=darkblue]Long[/color], [color=darkblue]ByVal[/color] y [color=darkblue]As[/color] [color=darkblue]Long[/color])

    [color=darkblue]Dim[/color] XVals [color=darkblue]As[/color] [color=darkblue]Variant[/color]
    [color=darkblue]Dim[/color] Vals [color=darkblue]As[/color] [color=darkblue]Variant[/color]
    [color=darkblue]Dim[/color] ElementID [color=darkblue]As[/color] [color=darkblue]Long[/color]
    [color=darkblue]Dim[/color] Arg1 [color=darkblue]As[/color] [color=darkblue]Long[/color]
    [color=darkblue]Dim[/color] Arg2 [color=darkblue]As[/color] [color=darkblue]Long[/color]
    
    [color=darkblue]Static[/color] CurrRow [color=darkblue]As[/color] [color=darkblue]Long[/color]
    
    target.GetChartElement x, y, ElementID, Arg1, Arg2
    
    [color=darkblue]If[/color] ElementID = xlSeries [color=darkblue]Then[/color]
        [color=darkblue]If[/color] bNew [color=darkblue]Then[/color]
            [color=darkblue]If[/color] CurrRow > 0 [color=darkblue]Then[/color]
                CurrRow = CurrRow + 1
                Cells(CurrRow + 1, "N").Resize(, 2).Interior.Color = vbYellow
            [color=darkblue]End[/color] [color=darkblue]If[/color]
            bNew = [color=darkblue]False[/color]
        [color=darkblue]End[/color] [color=darkblue]If[/color]
        [color=darkblue]If[/color] Arg2 <> PrevPoint [color=darkblue]Then[/color]
            XVals = target.SeriesCollection(Arg1).XValues
            Vals = target.SeriesCollection(Arg1).Values
            CurrRow = CurrRow + 1
            Cells(CurrRow + 1, "N").Value = XVals(Arg2)
            Cells(CurrRow + 1, "O").Value = Vals(Arg2)
            PrevPoint = Arg2
        [color=darkblue]End[/color] [color=darkblue]If[/color]
    [color=darkblue]End[/color] [color=darkblue]If[/color]
    
[color=darkblue]End[/color] [color=darkblue]Sub[/color]

So, in this case, moving your cursor to the chart area won't affect collection.
 
Last edited:
Upvote 0
That's great, I'm glad I could help. Just curious, though, which one are you going to use? Are you going to use the first one or the second one?
 
Upvote 0
Domenic,
i will use your code to mouse over the points of Drawing in chart of Second other thread for each segment to re-order the points to trace lines instead dots and make a drawing.
Those points are out of order, a problem that happens when you scan an image.
 
Upvote 0

Forum statistics

Threads
1,215,486
Messages
6,125,070
Members
449,205
Latest member
Healthydogs

We've detected that you are using an adblocker.

We have a great community of people providing Excel help here, but the hosting costs are enormous. You can help keep this site running by allowing ads on MrExcel.com.
Allow Ads at MrExcel

Which adblocker are you using?

Disable AdBlock

Follow these easy steps to disable AdBlock

1)Click on the icon in the browser’s toolbar.
2)Click on the icon in the browser’s toolbar.
2)Click on the "Pause on this site" option.
Go back

Disable AdBlock Plus

Follow these easy steps to disable AdBlock Plus

1)Click on the icon in the browser’s toolbar.
2)Click on the toggle to disable it for "mrexcel.com".
Go back

Disable uBlock Origin

Follow these easy steps to disable uBlock Origin

1)Click on the icon in the browser’s toolbar.
2)Click on the "Power" button.
3)Click on the "Refresh" button.
Go back

Disable uBlock

Follow these easy steps to disable uBlock

1)Click on the icon in the browser’s toolbar.
2)Click on the "Power" button.
3)Click on the "Refresh" button.
Go back
Back
Top