Ironman
Well-known Member
- Joined
- Jan 31, 2004
- Messages
- 1,069
- Office Version
- 365
- Platform
- Windows
Hi
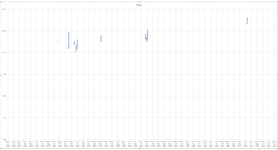
I'm trying to set up a new chart with dates on the X axis and pace (m:ss) on the Y axis.
The range is correct for both. The dates are displaying correctly on the X axis but the Y axis only displays 0:00 for all the entries and I don't understand why, as the Edit Series box shows a sample of the pace values in the expected format.
Help would be appreciated!
Thank you.
")