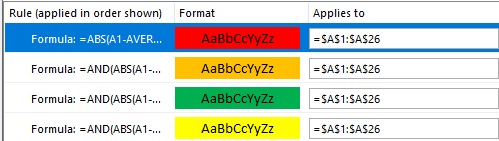
I"m trying to create a heat map in Excel by essentially finding the Z statistical value of normal distribution and coloring values far from the mean using conditional formatting. I calculate the Z as
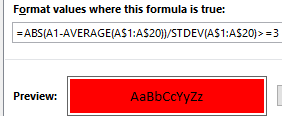
=ABS(AI2-AVERAGE(AI$2:AI$71))/STDEV(AI$2:AI$71) in each cell from the derived data above.
The values in the heat map are generally between 0-3 as you would suspect. But the colored heat map is over the calculated Z values.
Can i have the colored cells with the original derived data not the Z values?