SMcCafferty
New Member
- Joined
- May 5, 2022
- Messages
- 7
- Office Version
- 2016
- Platform
- Windows
I am using the formula below to count all cells that fall between two specified date/time ranges. From what I can tell, it is counting the cells between the two date/times but not the boundary cells which meet the criteria.
The function is counting cells on a separate worksheet, but is contained within the same workbook. The References AL2 and AL3 are helper cells I created to combine the Date and Time entered on the sheet specifying the date/time range needed.
=COUNTIFS('KPI Table'!AM3:AM491,">"&AL2,'KPI Table'!AM3:AM491,"<"&AL3)
I am also using SUMIFS formulas in the adjacent cells and getting the same result.
Any help would be greatly appreciated.
PS: Below is the code from the two sheets I am using captured by Xl2BB. Not sure if that is what you want. I dont see an option where I can upload the actual Excel file.
| Countifs Example.xlsx | ||||||
|---|---|---|---|---|---|---|
| A | B | C | D | |||
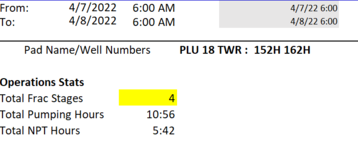
| 8 | Total Frac Stages | 4 | ||||
| 9 | Total Pumping Hours | 10:56 | ||||
| 10 | Total NPT Hours | 5:42 | ||||
Daily Ops Report | ||||||
| Cell Formulas | ||
|---|---|---|
| Range | Formula | |
| C8 | C8 | =COUNTIFS('KPI Table'!AM3:AM491,">"&AL2,'KPI Table'!AM3:AM491,"<"&AL3) |
| C9 | C9 | =SUMIFS('KPI Table'!AN3:AN491,'KPI Table'!AM3:AM491,"<="&AL3,'KPI Table'!AM3:AM491,">="&AL2) |
| C10 | C10 | =SUMIFS('KPI Table'!AO3:AO491,'KPI Table'!AM3:AM491,">="&AL2,'KPI Table'!AM3:AM491,"<="&AL3) |
| Countifs Example.xlsx | |||||||
|---|---|---|---|---|---|---|---|
| AK | AL | AM | AN | AO | |||
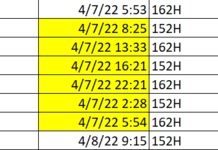
| 2 | Date | Pump End Time | Date-Time Helper | Pump Hours | NPT Hours | ||
| 3 | 4/7/2022 | 0:15 | 4/7/22 12:15 AM | 2:09 | 0:00 | ||
| 4 | 4/7/2022 | 5:53 | 4/7/22 5:53 AM | 2:38 | 2:30 | ||
| 5 | 4/7/2022 | 8:25 | 4/7/22 8:25 AM | 2:12 | 3:05 | ||
| 6 | 4/7/2022 | 13:33 | 4/7/22 1:33 PM | 3:30 | 1:08 | ||
| 7 | 4/7/2022 | 16:21 | 4/7/22 4:21 PM | 2:05 | 0:13 | ||
| 8 | 4/7/2022 | 22:21 | 4/7/22 10:21 PM | 3:09 | 1:16 | ||
| 9 | 4/7/2022 | 2:28 | 4/7/22 2:28 AM | 2:20 | 1:26 | ||
| 10 | 4/7/2022 | 5:54 | 4/7/22 5:54 AM | 2:17 | 0:39 | ||
| 11 | 4/8/2022 | 9:15 | 4/8/22 9:15 AM | 2:36 | 0:15 | ||
| 12 | 4/8/2022 | 15:40 | 4/8/22 3:40 PM | 2:40 | 3:15 | ||
| 13 | 4/9/2022 | 6:35 | 4/9/22 6:35 AM | 2:19 | 12:06 | ||
KPI Table | |||||||
| Cell Formulas | ||
|---|---|---|
| Range | Formula | |
| AK3:AK13 | AK3 | =IF('C:\Users\spmcc\Documents\4. Job Management Packet\[JMP 6.06 Vlookup.xlsm]Frac Stage Tracker'!A6="","",'C:\Users\spmcc\Documents\4. Job Management Packet\[JMP 6.06 Vlookup.xlsm]Frac Stage Tracker'!A6) |
| AL3:AL13 | AL3 | =IF('C:\Users\spmcc\Documents\4. Job Management Packet\[JMP 6.06 Vlookup.xlsm]Frac Stage Tracker'!L6="","",'C:\Users\spmcc\Documents\4. Job Management Packet\[JMP 6.06 Vlookup.xlsm]Frac Stage Tracker'!L6) |
| AM3:AM13 | AM3 | =AK3+AL3 |
| AN3:AN13 | AN3 | =IF('C:\Users\spmcc\Documents\4. Job Management Packet\[JMP 6.06 Vlookup.xlsm]Frac Stage Tracker'!M6="","",'C:\Users\spmcc\Documents\4. Job Management Packet\[JMP 6.06 Vlookup.xlsm]Frac Stage Tracker'!M6) |
| AO3:AO13 | AO3 | =IFERROR('C:\Users\spmcc\Documents\4. Job Management Packet\[JMP 6.06 Vlookup.xlsm]Frac Stage Tracker'!J6+'C:\Users\spmcc\Documents\4. Job Management Packet\[JMP 6.06 Vlookup.xlsm]Frac Stage Tracker'!P6,"") |