Hi, I'm a complete novice programmer and looking for some help with moving data from one worksheet to another.
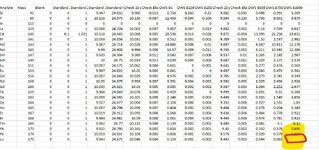
I have a "rawdata" sheet that comes out of an analysis report. The number of samples and elements in the report changes every time. I need a way to find each "Sample ID" in the rawdata, move it to columns in another sheet and then tabulate the " Measured intensities" into columns under each sample ID.
Desired result table:
There are two catches:
1) The number of elements can vary, so I need it to adjust to the number of elements.
2) I need the data as references back to "rawdata". So if the Sample ID for sample 1 is in "rawdata cell B2" I need the new worksheet to be "=rawdata!B2" and not just the copied value.
I also have a very old (~1997) macro that does similar functionality that I can provide. It does the searching and tabulating, but it only copies the data... it doesn't reference it.
I have a "rawdata" sheet that comes out of an analysis report. The number of samples and elements in the report changes every time. I need a way to find each "Sample ID" in the rawdata, move it to columns in another sheet and then tabulate the " Measured intensities" into columns under each sample ID.
| Example file 2.xlsx | ||||||||||
|---|---|---|---|---|---|---|---|---|---|---|
| A | B | C | D | E | F | G | H | |||
| 1 | Quantitative Analysis - Summary Report | |||||||||
| 2 | Sample ID: | Blank | ||||||||
| 3 | Sample Date/Time: | Thursday, July 03, 2014 14:44:54 | ||||||||
| 4 | Sample Description: | |||||||||
| 5 | Solution Type: | Blank | ||||||||
| 6 | Blank File: | C:\elandata_TERL Staff\Dataset\14-6035 Coleman PtCu\Blank.002 | ||||||||
| 7 | Number of Replicates: | 3 | ||||||||
| 8 | Peak Processing Mode: | Average | ||||||||
| 9 | Signal Profile Processing Mode: | Average | ||||||||
| 10 | Dual Detector Mode: | Dual | ||||||||
| 11 | Dead Time (ns): | 55 | ||||||||
| 12 | Sample File: | |||||||||
| 13 | Method File: | C:\elandata_TERL Staff\Method\TERL 2014\14-6035 Coleman PtCu\14-6035 Coleman PtCu.mth | ||||||||
| 14 | Dataset File: | C:\elandata_TERL Staff\Dataset\14-6035 Coleman PtCu\Blank.002 | ||||||||
| 15 | Tuning File: | C:\elandata_TERL Staff\Tuning\default.tun | ||||||||
| 16 | Optimization File: | C:\elandata_TERL Staff\Optimize\Default.dac | ||||||||
| 17 | Calibration File: | |||||||||
| 18 | Calibration Type: | External Calibration | ||||||||
| 19 | Summary | |||||||||
| 20 | Intensities | |||||||||
| 21 | Analyte | Mass | Meas. Intens. Mean | Meas. Intens. RSD | Blank Intensity | Blank Intens. RSD | ||||
| 22 | Cu | 63 | 36396 | 0.936 | ||||||
| 23 | Cu | 65 | 17159 | 0.318 | ||||||
| 24 | Pt | 194 | 3557 | 2.96 | ||||||
| 25 | Pt | 195 | 3644 | 3.932 | ||||||
| 26 | Pt | 196 | 2749 | 2.633 | ||||||
| 27 | Concentration Results | |||||||||
| 28 | Analyte | Mass | Net Intens. Mean | Conc. Mean | Conc. SD | Conc. RSD | Sample Unit | |||
| 29 | Cu | 63 | ppb | |||||||
| 30 | Cu | 65 | ppb | |||||||
| 31 | Pt | 194 | ppb | |||||||
| 32 | Pt | 195 | ppb | |||||||
| 33 | Pt | 196 | ppb | |||||||
| 34 | Quantitative Analysis - Summary Report | |||||||||
| 35 | Sample ID: | Standard 1 | ||||||||
| 36 | Sample Date/Time: | Thursday, July 03, 2014 14:46:46 | ||||||||
| 37 | Sample Description: | |||||||||
| 38 | Solution Type: | Standard | ||||||||
| 39 | Blank File: | C:\elandata_TERL Staff\Dataset\14-6035 Coleman PtCu\Blank.002 | ||||||||
| 40 | Number of Replicates: | 3 | ||||||||
| 41 | Peak Processing Mode: | Average | ||||||||
| 42 | Signal Profile Processing Mode: | Average | ||||||||
| 43 | Dual Detector Mode: | Dual | ||||||||
| 44 | Dead Time (ns): | 55 | ||||||||
| 45 | Sample File: | |||||||||
| 46 | Method File: | C:\elandata_TERL Staff\Method\TERL 2014\14-6035 Coleman PtCu\14-6035 Coleman PtCu.mth | ||||||||
| 47 | Dataset File: | C:\elandata_TERL Staff\Dataset\14-6035 Coleman PtCu\Standard 1.003 | ||||||||
| 48 | Tuning File: | C:\elandata_TERL Staff\Tuning\default.tun | ||||||||
| 49 | Optimization File: | C:\elandata_TERL Staff\Optimize\Default.dac | ||||||||
| 50 | Calibration File: | |||||||||
| 51 | Calibration Type: | External Calibration | ||||||||
| 52 | Summary | |||||||||
| 53 | Intensities | |||||||||
| 54 | Analyte | Mass | Meas. Intens. Mean | Meas. Intens. RSD | Blank Intensity | Blank Intens. RSD | ||||
| 55 | Cu | 63 | 147341 | 0.648 | 36395.71 | 0.936 | ||||
| 56 | Cu | 65 | 71904 | 0.157 | 17158.51 | 0.318 | ||||
| 57 | Pt | 194 | 116477 | 0.247 | 3557.363 | 2.96 | ||||
| 58 | Pt | 195 | 120655 | 0.113 | 3644.398 | 3.932 | ||||
| 59 | Pt | 196 | 91049 | 0.83 | 2749.416 | 2.633 | ||||
| 60 | Concentration Results | |||||||||
| 61 | Analyte | Mass | Net Intens. Mean | Conc. Mean | Conc. SD | Conc. RSD | Sample Unit | |||
| 62 | Cu | 63 | 110945.7 | 17.526 | 0.2 | 1.1 | ppb | |||
| 63 | Cu | 65 | 54745.73 | 17.643 | 0.05 | 0.3 | ppb | |||
| 64 | Pt | 194 | 112920.1 | 22.352 | 0.05 | 0.2 | ppb | |||
| 65 | Pt | 195 | 117010.3 | 22.475 | 0.02 | 0.1 | ppb | |||
| 66 | Pt | 196 | 88299.61 | 22.778 | 0.16 | 0.7 | ppb | |||
| 67 | Quantitative Analysis - Summary Report | |||||||||
| 68 | Sample ID: | Standard 2 | ||||||||
| 69 | Sample Date/Time: | Thursday, July 03, 2014 14:48:26 | ||||||||
| 70 | Sample Description: | |||||||||
| 71 | Solution Type: | Standard | ||||||||
| 72 | Blank File: | C:\elandata_TERL Staff\Dataset\14-6035 Coleman PtCu\Blank.002 | ||||||||
| 73 | Number of Replicates: | 3 | ||||||||
| 74 | Peak Processing Mode: | Average | ||||||||
| 75 | Signal Profile Processing Mode: | Average | ||||||||
| 76 | Dual Detector Mode: | Dual | ||||||||
| 77 | Dead Time (ns): | 55 | ||||||||
| 78 | Sample File: | |||||||||
| 79 | Method File: | C:\elandata_TERL Staff\Method\TERL 2014\14-6035 Coleman PtCu\14-6035 Coleman PtCu.mth | ||||||||
| 80 | Dataset File: | C:\elandata_TERL Staff\Dataset\14-6035 Coleman PtCu\Standard 2.004 | ||||||||
| 81 | Tuning File: | C:\elandata_TERL Staff\Tuning\default.tun | ||||||||
| 82 | Optimization File: | C:\elandata_TERL Staff\Optimize\Default.dac | ||||||||
| 83 | Calibration File: | |||||||||
| 84 | Calibration Type: | External Calibration | ||||||||
| 85 | Summary | |||||||||
| 86 | Intensities | |||||||||
| 87 | Analyte | Mass | Meas. Intens. Mean | Meas. Intens. RSD | Blank Intensity | Blank Intens. RSD | ||||
| 88 | Cu | 63 | 308326 | 0.419 | 36395.71 | 0.936 | ||||
| 89 | Cu | 65 | 152851 | 0.321 | 17158.51 | 0.318 | ||||
| 90 | Pt | 194 | 295181 | 1.282 | 3557.363 | 2.96 | ||||
| 91 | Pt | 195 | 304617 | 1.274 | 3644.398 | 3.932 | ||||
| 92 | Pt | 196 | 229665 | 1.2 | 2749.416 | 2.633 | ||||
| 93 | Concentration Results | |||||||||
| 94 | Analyte | Mass | Net Intens. Mean | Conc. Mean | Conc. SD | Conc. RSD | Sample Unit | |||
| 95 | Cu | 63 | 271930.4 | 51.126 | 0.27 | 0.5 | ppb | |||
| 96 | Cu | 65 | 135692.1 | 51.184 | 0.2 | 0.4 | ppb | |||
| 97 | Pt | 194 | 291623.8 | 52.852 | 0.65 | 1.2 | ppb | |||
| 98 | Pt | 195 | 300972.9 | 52.895 | 0.64 | 1.2 | ppb | |||
| 99 | Pt | 196 | 226915.4 | 52.928 | 0.6 | 1.1 | ppb | |||
| 100 | Quantitative Analysis - Summary Report | |||||||||
| 101 | Sample ID: | Standard 3 | ||||||||
| 102 | Sample Date/Time: | Thursday, July 03, 2014 14:50:01 | ||||||||
| 103 | Sample Description: | |||||||||
| 104 | Solution Type: | Standard | ||||||||
| 105 | Blank File: | C:\elandata_TERL Staff\Dataset\14-6035 Coleman PtCu\Blank.002 | ||||||||
| 106 | Number of Replicates: | 3 | ||||||||
| 107 | Peak Processing Mode: | Average | ||||||||
| 108 | Signal Profile Processing Mode: | Average | ||||||||
| 109 | Dual Detector Mode: | Dual | ||||||||
| 110 | Dead Time (ns): | 55 | ||||||||
| 111 | Sample File: | |||||||||
| 112 | Method File: | C:\elandata_TERL Staff\Method\TERL 2014\14-6035 Coleman PtCu\14-6035 Coleman PtCu.mth | ||||||||
| 113 | Dataset File: | C:\elandata_TERL Staff\Dataset\14-6035 Coleman PtCu\Standard 3.005 | ||||||||
| 114 | Tuning File: | C:\elandata_TERL Staff\Tuning\default.tun | ||||||||
| 115 | Optimization File: | C:\elandata_TERL Staff\Optimize\Default.dac | ||||||||
| 116 | Calibration File: | |||||||||
| 117 | Calibration Type: | External Calibration | ||||||||
| 118 | Summary | |||||||||
| 119 | Intensities | |||||||||
| 120 | Analyte | Mass | Meas. Intens. Mean | Meas. Intens. RSD | Blank Intensity | Blank Intens. RSD | ||||
| 121 | Cu | 63 | 555730 | 3.809 | 36395.71 | 0.936 | ||||
| 122 | Cu | 65 | 276612 | 4.987 | 17158.51 | 0.318 | ||||
| 123 | Pt | 194 | 521549 | 8.756 | 3557.363 | 2.96 | ||||
| 124 | Pt | 195 | 536287 | 8.733 | 3644.398 | 3.932 | ||||
| 125 | Pt | 196 | 402891 | 8.323 | 2749.416 | 2.633 | ||||
| 126 | Concentration Results | |||||||||
| 127 | Analyte | Mass | Net Intens. Mean | Conc. Mean | Conc. SD | Conc. RSD | Sample Unit | |||
| 128 | Cu | 63 | 519334.5 | 102.764 | 4.42 | 4.3 | ppb | |||
| 129 | Cu | 65 | 259453.7 | 102.466 | 5.72 | 5.6 | ppb | |||
| 130 | Pt | 194 | 517991.8 | 91.487 | 7.79 | 8.5 | ppb | |||
| 131 | Pt | 195 | 532642.7 | 91.203 | 7.74 | 8.5 | ppb | |||
| 132 | Pt | 196 | 400141.3 | 90.607 | 7.29 | 8.1 | ppb | |||
| 133 | Quantitative Analysis - Summary Report | |||||||||
| 134 | Sample ID: | Standard 4 | ||||||||
| 135 | Sample Date/Time: | Thursday, July 03, 2014 14:51:44 | ||||||||
| 136 | Sample Description: | |||||||||
| 137 | Solution Type: | Standard | ||||||||
| 138 | Blank File: | C:\elandata_TERL Staff\Dataset\14-6035 Coleman PtCu\Blank.002 | ||||||||
| 139 | Number of Replicates: | 3 | ||||||||
| 140 | Peak Processing Mode: | Average | ||||||||
| 141 | Signal Profile Processing Mode: | Average | ||||||||
| 142 | Dual Detector Mode: | Dual | ||||||||
| 143 | Dead Time (ns): | 55 | ||||||||
| 144 | Sample File: | |||||||||
| 145 | Method File: | C:\elandata_TERL Staff\Method\TERL 2014\14-6035 Coleman PtCu\14-6035 Coleman PtCu.mth | ||||||||
| 146 | Dataset File: | C:\elandata_TERL Staff\Dataset\14-6035 Coleman PtCu\Standard 4.006 | ||||||||
| 147 | Tuning File: | C:\elandata_TERL Staff\Tuning\default.tun | ||||||||
| 148 | Optimization File: | C:\elandata_TERL Staff\Optimize\Default.dac | ||||||||
| 149 | Calibration File: | |||||||||
| 150 | Calibration Type: | External Calibration | ||||||||
| 151 | Summary | |||||||||
| 152 | Intensities | |||||||||
| 153 | Analyte | Mass | Meas. Intens. Mean | Meas. Intens. RSD | Blank Intensity | Blank Intens. RSD | ||||
| 154 | Cu | 63 | 1014815 | 0.098 | 36395.71 | 0.936 | ||||
| 155 | Cu | 65 | 508876 | 0.191 | 17158.51 | 0.318 | ||||
| 156 | Pt | 194 | 1176724 | 0.393 | 3557.363 | 2.96 | ||||
| 157 | Pt | 195 | 1214962 | 0.992 | 3644.398 | 3.932 | ||||
| 158 | Pt | 196 | 922769 | 1.09 | 2749.416 | 2.633 | ||||
| 159 | Concentration Results | |||||||||
| 160 | Analyte | Mass | Net Intens. Mean | Conc. Mean | Conc. SD | Conc. RSD | Sample Unit | |||
| 161 | Cu | 63 | 978419.8 | 198.584 | 0.21 | 0.1 | ppb | |||
| 162 | Cu | 65 | 491717.3 | 198.707 | 0.4 | 0.2 | ppb | |||
| 163 | Pt | 194 | 1173166 | 203.308 | 0.79 | 0.4 | ppb | |||
| 164 | Pt | 195 | 1211318 | 203.427 | 1.99 | 1 | ppb | |||
| 165 | Pt | 196 | 920020.1 | 203.687 | 2.19 | 1.1 | ppb | |||
| 166 | Quantitative Analysis - Summary Report | |||||||||
| 167 | Sample ID: | Std 2 A | ||||||||
| 168 | Sample Date/Time: | Thursday, July 03, 2014 14:54:21 | ||||||||
| 169 | Sample Description: | |||||||||
| 170 | Solution Type: | Sample | ||||||||
| 171 | Blank File: | C:\elandata_TERL Staff\Dataset\14-6035 Coleman PtCu\Blank.002 | ||||||||
| 172 | Number of Replicates: | 3 | ||||||||
| 173 | Peak Processing Mode: | Average | ||||||||
| 174 | Signal Profile Processing Mode: | Average | ||||||||
| 175 | Dual Detector Mode: | Dual | ||||||||
| 176 | Dead Time (ns): | 55 | ||||||||
| 177 | Sample File: | |||||||||
| 178 | Method File: | C:\elandata_TERL Staff\Method\TERL 2014\14-6035 Coleman PtCu\14-6035 Coleman PtCu.mth | ||||||||
| 179 | Dataset File: | C:\elandata_TERL Staff\Dataset\14-6035 Coleman PtCu\Std 2 A.007 | ||||||||
| 180 | Tuning File: | C:\elandata_TERL Staff\Tuning\default.tun | ||||||||
| 181 | Optimization File: | C:\elandata_TERL Staff\Optimize\Default.dac | ||||||||
| 182 | Calibration File: | |||||||||
| 183 | Calibration Type: | External Calibration | ||||||||
| 184 | Summary | |||||||||
| 185 | Intensities | |||||||||
| 186 | Analyte | Mass | Meas. Intens. Mean | Meas. Intens. RSD | Blank Intensity | Blank Intens. RSD | ||||
| 187 | Cu | 63 | 278434 | 0.352 | 36395.71 | 0.936 | ||||
| 188 | Cu | 65 | 136601 | 0.344 | 17158.51 | 0.318 | ||||
| 189 | Pt | 194 | 300147 | 0.817 | 3557.363 | 2.96 | ||||
| 190 | Pt | 195 | 309079 | 0.62 | 3644.398 | 3.932 | ||||
| 191 | Pt | 196 | 231508 | 1.045 | 2749.416 | 2.633 | ||||
| 192 | Concentration Results | |||||||||
| 193 | Analyte | Mass | Net Intens. Mean | Conc. Mean | Conc. SD | Conc. RSD | Sample Unit | |||
| 194 | Cu | 63 | 242038.6 | 44.887 | 0.2 | 0.5 | ppb | |||
| 195 | Cu | 65 | 119442.8 | 44.451 | 0.19 | 0.4 | ppb | |||
| 196 | Pt | 194 | 296589.9 | 53.7 | 0.42 | 0.8 | ppb | |||
| 197 | Pt | 195 | 305434.4 | 53.632 | 0.32 | 0.6 | ppb | |||
| 198 | Pt | 196 | 228758.5 | 53.329 | 0.53 | 1 | ppb | |||
rawdata | ||||||||||
Desired result table:
| Example file 2.xlsx | |||||||||||
|---|---|---|---|---|---|---|---|---|---|---|---|
| A | B | C | D | E | F | G | H | I | |||
| 1 | I'd like to get the intensity data from "rawdata" for each sample into a table like the one below it, with referenced cells to "rawdata" (not Copy/Pasted from raw data) | ||||||||||
| 2 | with the "analytes and masses" down the rows (once per dataset is enough) and then each column be the "Sample ID" and 'Measured intensities" from each sample | ||||||||||
| 3 | |||||||||||
| 4 | Example Table: | ||||||||||
| 5 | |||||||||||
| 6 | Analyte | Mass | Blank | Standard 1 | Standard 2 | Standard 3 | Standard 4 | Std 2 A | |||
| 7 | Cu | 63 | 36396 | 147341 | 308326 | 555730 | 1014815 | 278434 | |||
| 8 | Cu | 65 | 17159 | 71904 | 152851 | 276612 | 508876 | 136601 | |||
| 9 | Pt | 194 | 3557 | 116477 | 295181 | 521549 | 1176724 | 300147 | |||
| 10 | Pt | 195 | 3644 | 120655 | 304617 | 536287 | 1214962 | 309079 | |||
| 11 | Pt | 196 | 2749 | 91049 | 229665 | 402891 | 922769 | 231508 | |||
intens | |||||||||||
| Cell Formulas | ||
|---|---|---|
| Range | Formula | |
| A6:B11,C7:C11 | A6 | =rawdata!B21 |
| C6 | C6 | =rawdata!B2 |
| D6 | D6 | =rawdata!B35 |
| E6 | E6 | =rawdata!B68 |
| F6 | F6 | =rawdata!B101 |
| G6 | G6 | =rawdata!B134 |
| H6 | H6 | =rawdata!B167 |
| D7:D11 | D7 | =rawdata!D55 |
| E7:E11 | E7 | =rawdata!D88 |
| F7:F11 | F7 | =rawdata!D121 |
| G7:G11 | G7 | =rawdata!D154 |
| H7:H11 | H7 | =rawdata!D187 |
There are two catches:
1) The number of elements can vary, so I need it to adjust to the number of elements.
2) I need the data as references back to "rawdata". So if the Sample ID for sample 1 is in "rawdata cell B2" I need the new worksheet to be "=rawdata!B2" and not just the copied value.
I also have a very old (~1997) macro that does similar functionality that I can provide. It does the searching and tabulating, but it only copies the data... it doesn't reference it.