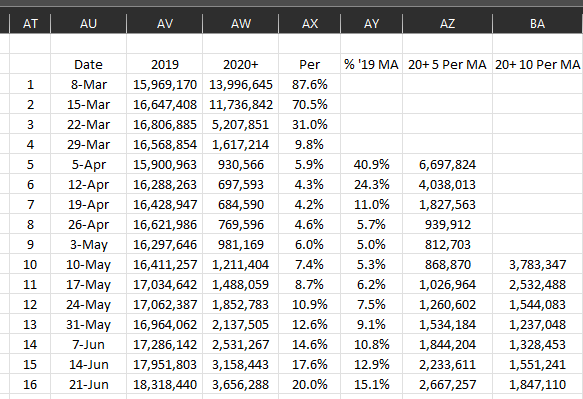
I have a dataset that looks like this:
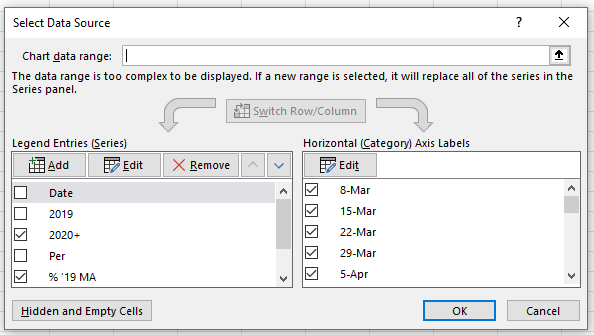
And have been able to set up the data source like this:
But not matter what I do I can't get the dates to actually appear correctly on the chart:
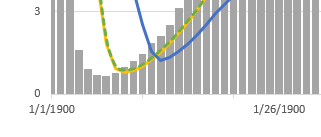
If I have date selected (as above) it's merely applying date formatting to 1, 2, 3.... and not referencing the column I want.
How do I get the actual text dates referenced in column AU above to me the horizontal labels on the chart?
As much as I love Excel, sometimes it does its best to drive me crazy like this.......
And have been able to set up the data source like this:
But not matter what I do I can't get the dates to actually appear correctly on the chart:
If I have date selected (as above) it's merely applying date formatting to 1, 2, 3.... and not referencing the column I want.
How do I get the actual text dates referenced in column AU above to me the horizontal labels on the chart?
As much as I love Excel, sometimes it does its best to drive me crazy like this.......


