DAX Lookup by Limit

srehman

Board Regular
Joined
Jan 4, 2020
Messages
210
Office Version
  1. 2016
Platform
  1. Windows
Hi Team,

I need to achieved result by DAX.

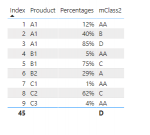
Class table & Product table lookup (if percentage less than or equal to 15% assign class "AA" and so on.
I have watched some videos about frequency category. But here everything in percentages.

Product percentages achieved from Qty could be any , i can provide it if you need any info.

Please if this data not help to achieved results or not according forum please disregard this post.

Thanks


Book1
AB
2Class Table
3ClassCalss Percentages
4AA15%
5A30%
6B50%
7C75%
8D100%
Sheet1


Book1
EFG
2Prouduct TableNeed to achieved by DAX
3ProuductPercentagesLESS THAN OR EQUAL TO CLASS Percenatge
4A112%AA
5A140%B
6A185%C
7B15%AA
8B175%C
9B229%A
10C10.5%AA
11C262%C
12C34%AA
Sheet1
 

Excel Facts

Create a chart in one keystroke
Select the data and press Alt+F1 to insert a default chart. You can change the default chart to any chart type
Hi srehman,

I think this should be achievable via DAX.

Before I proceed with my formula, I need to make sure that my understanding of your scenario is correct - shouldn't row 6 (85%) result in "D" class instead of "C" class? 85% is less than or equal to 100% (class D), not 75% (class C).
 
Upvote 0
Absolutely correct sorry typo thanks for your's thoughts.
Waiting for your approach.
 
Upvote 0
Great, thanks for confirming!

You can try this method -

Step 1 - add "Class Order" to your Class table (in Power BI, click on a table and go to Table Tools > New column). This will rank your classes in descending order.

Rich (BB code):
Class Order = RANK.EQ(tbl_Class[Class Percentages], tbl_Class[Class Percentages], DESC)

1598020482975.png


Step 2 - create a measure that will count how many rows in Class table are greater than or equal to a current percentage.

Rich (BB code):
mClass = 
    var vCount =
        COUNTROWS(FILTER(tbl_Class, MAX(tbl_Product[Percentages]) <= tbl_Class[Class Percentages]))
return
    vCount

1598020617892.png


Do you see where we're going from here? :) the measure actually also returns the value that matches the Class Order that we want to return. Let's wrap up.

Step 3 - adjust your newly created measure to return the final result -

mClass =
var vCount =
COUNTROWS(FILTER(tbl_Class, MAX(tbl_Product[Percentages]) <= tbl_Class[Class Percentages]))
return
LOOKUPVALUE(tbl_Class[Class], tbl_Class[Class Order], vCount)

1598020683077.png
 
Upvote 0
Hi JustynaMK,

Thanks a lot for your support.
Actually i am very excited to use your approach, unfortunately i stuck in step 2, I understood Logic but i am wondering in Step 2 mclass column i am getting 111111 for all rows which is not matching as per your snapshot. definitely i am doing some mistake.
As i highlighted with yellow color in a snapshot.

Would you please check where i am wrong.
 

Attachments

  • step 2 stuck.PNG
    step 2 stuck.PNG
    74.9 KB · Views: 3
Upvote 0
Hi,

if am not much focus on step 2 , and follow step 3 , Obviously step 3 came from step 2 ,

copy your step 3 formula i can achieved results. which is awesome.

pls check snapshot.
 

Attachments

  • Result.PNG
    Result.PNG
    7 KB · Views: 6
Upvote 0
Amazing! Glad that it worked for you :) as per your first screenshot, it might be that the issue occurs because you have created both a "calculated column" and "measure" called mClass. Depending on which one you have used in your table, I'd expect "calculated column" to return 1 for each row, and "measure" to return proper results.

Anyways, I'm happy it all ended up working nicely. Have a great weekend!

1598080142059.png
 
Upvote 0
Thanks for above solution it is working perfectly.

Sorry to bother you again, i have to create relationship between 2 tables based on above measures, It should connected by relationship.
I have watched ExcelFun videos he does it , but i could't.

I need to check each product how many times in ABC Class.

Any thoughts


Example

ClassAAABCD
A1
1​
1​
1​
B1
1​
1​
B2
1​
C1
1​
C2
1​
C3
1​
 

Attachments

  • Relationship.PNG
    Relationship.PNG
    31.4 KB · Views: 4
Upvote 0
Good morning,

Unfortunately this approach won't work, as measures cannot participate in relationships. You would need to convert the measure into a calculated column in order to have it available in your Data Model. GIve it a try and let me know if you get stuck.
 
Upvote 0

Forum statistics

Threads
1,216,116
Messages
6,128,931
Members
449,480
Latest member
yesitisasport

We've detected that you are using an adblocker.

We have a great community of people providing Excel help here, but the hosting costs are enormous. You can help keep this site running by allowing ads on MrExcel.com.
Allow Ads at MrExcel

Which adblocker are you using?

Disable AdBlock

Follow these easy steps to disable AdBlock

1)Click on the icon in the browser’s toolbar.
2)Click on the icon in the browser’s toolbar.
2)Click on the "Pause on this site" option.
Go back

Disable AdBlock Plus

Follow these easy steps to disable AdBlock Plus

1)Click on the icon in the browser’s toolbar.
2)Click on the toggle to disable it for "mrexcel.com".
Go back

Disable uBlock Origin

Follow these easy steps to disable uBlock Origin

1)Click on the icon in the browser’s toolbar.
2)Click on the "Power" button.
3)Click on the "Refresh" button.
Go back

Disable uBlock

Follow these easy steps to disable uBlock

1)Click on the icon in the browser’s toolbar.
2)Click on the "Power" button.
3)Click on the "Refresh" button.
Go back
Back
Top