colts4u
New Member
- Joined
- Jan 18, 2022
- Messages
- 11
- Office Version
- 365
- Platform
- Windows
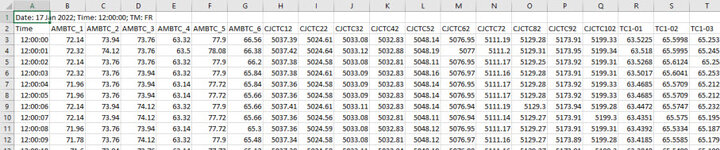
I have data with values from thermocouple channels at certain times. The channels have names and are all in the same row and each has it's own column. The first column is the time and then each column thereafter are data for each channel. I've included an image of some of the data to help. I chart this data from selected channels I want to see. Because there is so much data, I delete what I don't want to chart. I have to do this manually and is very time consuming. I've made some VBA to help me create a chart with the data I want after I manually delete the columns I don't want. The data is in a CSV file, so I run my code once I've deleted the data I don't want. Could someone help me with VBA that could delete that columns of data I do not want automatically? So far, I have created named ranges. For example, "_pos1" refers to a range of cells, 4 cells with a channel name in each cell. The plan was to have a checkboxes on a form that would refer to each named range. If you selected "checkbox1", the code would delete all the other columns and just leave the columns that equaled the named range of channels. I've done some searching, but haven't been able to put some code together to make this work. Any ideas?