Hi,
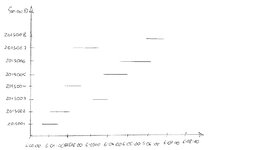
I have been thinking for some time now about making a downtime tracking timeline in a form of a line graph. The x axis would be time and y axis would be different stations (max of about 25 unique stations). Downtime would be represented as a vertical line. I have a data sheet with start time, end time, unique station identifier and duration in seconds. I have been trying to find some sort of solution or where to start using web search but no luck. I am not sure if this is possible but can anyone help?
Thanks in advance.
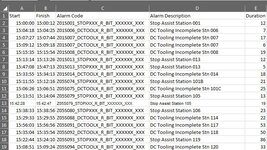
Attached a small data sample.
I have been thinking for some time now about making a downtime tracking timeline in a form of a line graph. The x axis would be time and y axis would be different stations (max of about 25 unique stations). Downtime would be represented as a vertical line. I have a data sheet with start time, end time, unique station identifier and duration in seconds. I have been trying to find some sort of solution or where to start using web search but no luck. I am not sure if this is possible but can anyone help?
Thanks in advance.
Attached a small data sample.