Dymamically Change Marker Size and Background Color of XY Scatter Chart

MJU007

New Member
Joined
Feb 6, 2016
Messages
6
Hi all, I have a problem that I've literally lost sleep over

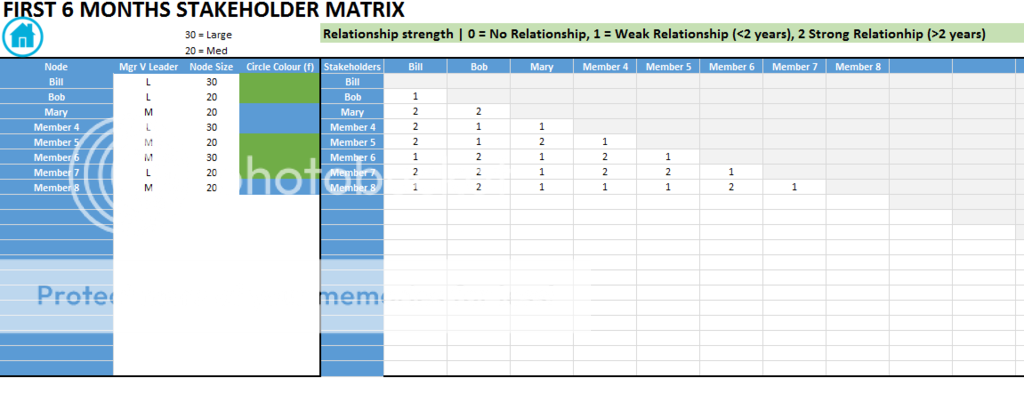
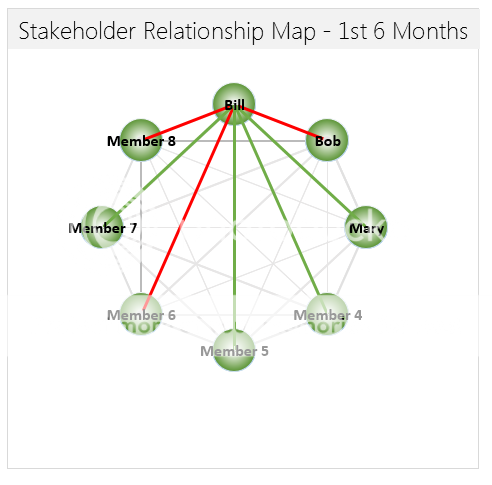
I have a XY Scatter with Straight Lines and Markers chart. This chart shows a stakeholder relationship between the different team members.

For each member, we want to define a marker colour and size. The members, sizes and colours will be specific to each client the report is presented to. In addition the number of members will range from 5 to 15.

I know how to do this with a standard line chart. However, the same concept doesn't seem to work with the XY Scatter.

Can any one help?

Thanking you in advance.
M.
 

Excel Facts

Return population for a City
If you have a list of cities in A2:A100, use Data, Geography. Then =A2.Population and copy down.
Hi and welcome to the Board

See if this helps:

Code:
Sub FormatScatter()
Dim s As Series, ch As Chart, r, g, b, i%, j%
r = Array(200, 150, 100, 50, 180)                           ' red components
g = Array(40, 80, 140, 180, 240)                            ' green components
b = Array(100, 150, 200, 30, 190)                           ' blue components
Set ch = ActiveSheet.ChartObjects("Chart5").Chart
ch.ChartType = xlXYScatterLines
For i = 0 To UBound(r)                                      ' loop series
    For j = 1 To ch.SeriesCollection(i + 1).Points.Count    ' loop points
        Set s = ch.SeriesCollection(i + 1)
        s.Points(j).Format.Fill.ForeColor.RGB = RGB(r(i), g(i), b(i))
        s.Points(j).MarkerSize = 7 + 2 * i
    Next
Next
End Sub
 
Upvote 0
Thanks for replying. As I am still trying to come up to speed with the VB please forgive my ignorance, but I need to define the colour and size in the spreadsheet against the stakeholder/member. I can't determine from this script where it gets its size and color instructions from.

regards
M.
 
Upvote 0
At the moment color and size are set entirely by code. Would you like to get this information from a sheet range?

Code:
Sub FormatScatter()
Dim s As Series, ch As Chart, r, g, b, i%, j%
r = Array(200, 150, 100, 50, 80)                           ' red components
g = Array(40, 80, 140, 180, 40)                            ' green components
b = Array(100, 150, 200, 30, 190)                           ' blue components
Set ch = ActiveSheet.ChartObjects("Chart5").Chart           ' your chart name here
ch.ChartType = xlXYScatterLines
For i = 0 To UBound(r)                                      ' loop series
    For j = 1 To ch.SeriesCollection(i + 1).Points.Count    ' loop points
        Set s = ch.SeriesCollection(i + 1)
        s.Points(j).Format.Fill.ForeColor.RGB = RGB(r(i), g(i), b(i))   ' set point colour
        s.Points(j).MarkerSize = 7 + 2 * i                              ' set marker size
    Next
Next
End Sub
 
Upvote 0
Yes. In my original post I uploaded the excel worksheet with an example of the chart and the information it used to generate it. (I'd upload it against this reply, but I can't find how I would do it.)

On the 2nd tab, we enter the names of each person in the team, allocate a colour, size and then specify the relationship strength to the other members.
Entry_zpsfkft0rgv.png


This then presents us with our stakeholder map (first tab)

map_zps0x9xmr3e.png


I have managed to get everything working except for the dynamic colour and size that was entered against the person in the 2nd sheet.

Is this something that is even possible?

regards
M.
 
Upvote 0
Whoops.. looks like I was dreaming about uploading it... it must be the lack of sleep over this :(
 
Upvote 0
Is this something that is even possible?
I think so.

You can upload the workbook to a sharing site like Drop Box and paste the link here.
I can offer a quicker solution working with the actual file.
 
Upvote 0
Hi

I’m on Excel 2007 today, so I can’t use the slicer. What version are you using?
When I dismantled the chart, the code below worked, see the picture. However it did nothing with the original chart.
Anyway, see what happens with your Excel version and post back.

bub.JPG


Code:
Sub FormatMap()
Dim sh As Worksheet, ch As Chart, csh As Worksheet, s As Series, i%, c&, tl As Range
Set csh = Sheets("RELATIONSHIP MAP")
Set ch = csh.ChartObjects("SHMap2").Chart
Set sh = Sheets("2. DATA GUIDING")
Set s = ch.SeriesCollection("Stakeholder Dots")
Set tl = sh.[a30]                                           ' top left cell of data table
For i = 1 To 20                                             ' all possible members
    If Len(tl.Offset(i)) Then                               ' member exists
        s.Points(i).MarkerSize = tl.Offset(i, 2)            ' change marker size
        c = tl.Offset(i, 3).Interior.Color                  ' get cell color
        s.Points(i).Format.Fill.ForeColor.RGB = RGB(c Mod 256, c \ 256 Mod 256, c \ 65536 Mod 256)
    End If
Next
End Sub
 
Upvote 0
Hi, I use both 2013 and 2016. The code works a treat!!! You are an absolute legend :)

Thanks so very much
M.
 
Upvote 0

Forum statistics

Threads
1,215,333
Messages
6,124,317
Members
449,153
Latest member
JazzSingerNL

We've detected that you are using an adblocker.

We have a great community of people providing Excel help here, but the hosting costs are enormous. You can help keep this site running by allowing ads on MrExcel.com.
Allow Ads at MrExcel

Which adblocker are you using?

Disable AdBlock

Follow these easy steps to disable AdBlock

1)Click on the icon in the browser’s toolbar.
2)Click on the icon in the browser’s toolbar.
2)Click on the "Pause on this site" option.
Go back

Disable AdBlock Plus

Follow these easy steps to disable AdBlock Plus

1)Click on the icon in the browser’s toolbar.
2)Click on the toggle to disable it for "mrexcel.com".
Go back

Disable uBlock Origin

Follow these easy steps to disable uBlock Origin

1)Click on the icon in the browser’s toolbar.
2)Click on the "Power" button.
3)Click on the "Refresh" button.
Go back

Disable uBlock

Follow these easy steps to disable uBlock

1)Click on the icon in the browser’s toolbar.
2)Click on the "Power" button.
3)Click on the "Refresh" button.
Go back
Back
Top