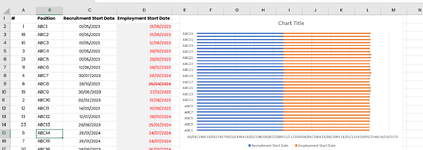
Hi, I created a stacked bar chart to reflect as a gant chart and show the movement in between 2 dates as stages however the x axes doesnt give me the option to change to "months" and spreads the data over many years instead of just over 2 or 3 year spread by month.
Thanks for your advices
Thanks for your advices