Hi,
I found an error when a line chart has only 1 data point to plot see first chart.
If I add same value for second month then it plots see second chart.

How to fix this situation?
I was thinking Error Bar with Point but I don't know how to do that.
Your help would be greatly appreciated.
Biz
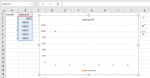
I found an error when a line chart has only 1 data point to plot see first chart.
If I add same value for second month then it plots see second chart.
How to fix this situation?
I was thinking Error Bar with Point but I don't know how to do that.
Your help would be greatly appreciated.
Biz