Peter Davison
Active Member
- Joined
- Jun 4, 2020
- Messages
- 444
- Office Version
- 365
- Platform
- Windows
Hi,
I have a pivot table with multiple columns, but for what I want I am only using -
1. Product Code
2. Sales % formularised as an acculmative
3. Product Code formularise as an acculmative % (Basically the number of times the product code has sales)
Whilst I know how to get the top and bottom 'n' amount using the filter
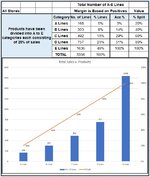
Is there a way of dividing all the products into 5 blocks A to E (each having 20% of the products)
So I can show in a pivot chart - The % sales achieved from each 20% block of products?
I have achieved it not in a pivot using formulas, but I would like it to be a Pivot Chart so it is dynamic with other pivot charts
I have attached a jpg of how I achieved it using formulas
Any help would be great.
Thanks
I have a pivot table with multiple columns, but for what I want I am only using -
1. Product Code
2. Sales % formularised as an acculmative
3. Product Code formularise as an acculmative % (Basically the number of times the product code has sales)
Whilst I know how to get the top and bottom 'n' amount using the filter
Is there a way of dividing all the products into 5 blocks A to E (each having 20% of the products)
So I can show in a pivot chart - The % sales achieved from each 20% block of products?
I have achieved it not in a pivot using formulas, but I would like it to be a Pivot Chart so it is dynamic with other pivot charts
I have attached a jpg of how I achieved it using formulas
Any help would be great.
Thanks