rambodanbo77
New Member
- Joined
- Jul 18, 2010
- Messages
- 1
Hi all,
I have a very detailed question...
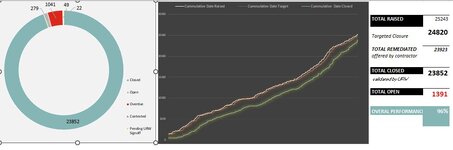
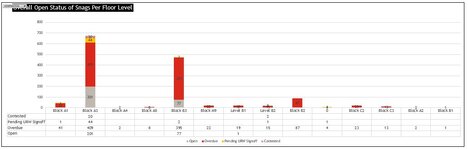
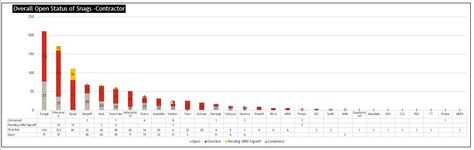
I have commenced a job, and part of the reporting within it is to provide a summary of the snags raised on a project. My predecessor used an excel to report the data and the output is the files attached:
It is a painful exercise each month to tweak the spreadsheet in order to ensure the output charts are correct, and I wondered whether Power BI would be able to tackle this sufficiently? I have the free copy of Power BI, so assuming this is possible - would it be an issue with the free version? Or, would I need Power BI Pro?
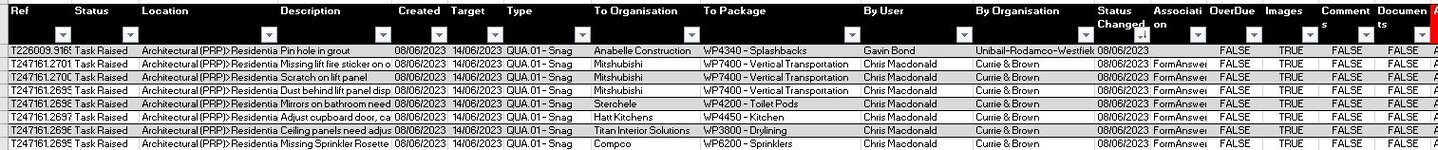
There are circa 25,000 rows on the spreadsheet. I did hope to be able to upload a cut down version of the excel, but it doesn't appear to be allowed. I appreciate it would be easier to understand with a copy of the spreadsheet...
Here are some of the key formulas:
Overall status (column AF in "FVData tab):
=IF(AND([@[SNAG STATUS]],[@[Overdue Contractor]]="Open"),"Open",IF(AND([@[SNAG STATUS]]="Resolved",[@[Overdue Contractor]]="Overdue"),"Pending URW Signoff",IF(AND([@[SNAG STATUS]],[@[Overdue Contractor]]="Resolved"),"Pending URW Signoff",IF([@[SNAG STATUS]]="Rejected","Contested",IF(AND([@[SNAG STATUS]]="Open",[@[Overdue Contractor]]="Overdue"),"Overdue","Closed")))))
Total Remediated (cell E7 in "DASHBOARD" tab):
=SUM(GETPIVOTDATA("OVERALL STATUS",$V$5,"OVERALL STATUS","Closed")+GETPIVOTDATA("OVERALL STATUS",$V$5,"OVERALL STATUS","Contested")+GETPIVOTDATA("OVERALL STATUS",$V$5,"OVERALL STATUS","Pending URW Signoff"))
Total Closed (cell E10 in "DASHBOARD" tab):
=GETPIVOTDATA("OVERALL STATUS",$V$5,"OVERALL STATUS","Closed")
Target closure (cell E5 in "DASHBOARD" tab, which is a number extracted from "Project run rate" tab for the specific date of the report)
=SUM($C$4:AJP4)
Any help would be greatly appreciated.
I have a very detailed question...
I have commenced a job, and part of the reporting within it is to provide a summary of the snags raised on a project. My predecessor used an excel to report the data and the output is the files attached:
- Overall Status
- Snag by block/ Level
- Snag by Contractor
It is a painful exercise each month to tweak the spreadsheet in order to ensure the output charts are correct, and I wondered whether Power BI would be able to tackle this sufficiently? I have the free copy of Power BI, so assuming this is possible - would it be an issue with the free version? Or, would I need Power BI Pro?
There are circa 25,000 rows on the spreadsheet. I did hope to be able to upload a cut down version of the excel, but it doesn't appear to be allowed. I appreciate it would be easier to understand with a copy of the spreadsheet...
Here are some of the key formulas:
Overall status (column AF in "FVData tab):
=IF(AND([@[SNAG STATUS]],[@[Overdue Contractor]]="Open"),"Open",IF(AND([@[SNAG STATUS]]="Resolved",[@[Overdue Contractor]]="Overdue"),"Pending URW Signoff",IF(AND([@[SNAG STATUS]],[@[Overdue Contractor]]="Resolved"),"Pending URW Signoff",IF([@[SNAG STATUS]]="Rejected","Contested",IF(AND([@[SNAG STATUS]]="Open",[@[Overdue Contractor]]="Overdue"),"Overdue","Closed")))))
Total Remediated (cell E7 in "DASHBOARD" tab):
=SUM(GETPIVOTDATA("OVERALL STATUS",$V$5,"OVERALL STATUS","Closed")+GETPIVOTDATA("OVERALL STATUS",$V$5,"OVERALL STATUS","Contested")+GETPIVOTDATA("OVERALL STATUS",$V$5,"OVERALL STATUS","Pending URW Signoff"))
Total Closed (cell E10 in "DASHBOARD" tab):
=GETPIVOTDATA("OVERALL STATUS",$V$5,"OVERALL STATUS","Closed")
Target closure (cell E5 in "DASHBOARD" tab, which is a number extracted from "Project run rate" tab for the specific date of the report)
=SUM($C$4:AJP4)
Any help would be greatly appreciated.