Find First and Last Period in 2D Table

excelstudy11

New Member
Joined
Nov 15, 2023
Messages
2
Office Version
  1. 365
Platform
  1. Windows
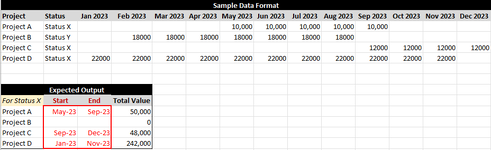
I'm trying to remember how to best structure a formula to calculate the first date of a project's incomes and the last date in a large multi-dimensional table.

It's been a while since I've had to structure data in this format and tackle a need like this, and am hitting a wall on the right approach to realize the min and max array positions based on the interior value of the table.

I am attaching a sample view. To structure the data I have a named array for Data_Months(C2:N2), Data_Projects (A3:A6), Data_Status (B3:B6) and Data_Values (C3:N6)

I feel like there should be a way to get to this via nested conditional xlookup or old-school index match to find the min/max array value in Data_Months where Data_Projects = Project Name Reference (from output table) and where Data_Value > 0 (and add in Project Status = Reference from Output Table to test logic with additional reference parameters since I will need to layer more in)

I just am tripping myself up on how to create that array of Data_Month indexes where Project = True and Value > 0 to then process in-formula (ie not creating output arrays to parse in a 2nd step).

Let me know if this makes sense and if anyone can help remind me how to best do this.
 

Attachments

  • Screenshot 2023-11-15 160153.png
    Screenshot 2023-11-15 160153.png
    19.6 KB · Views: 8

Excel Facts

Easy bullets in Excel
If you have a numeric keypad, press Alt+7 on numeric keypad to type a bullet in Excel.
Welcome to the MrExcel board!

I have not used any of your named ranges, but see if you can use any of this as a start.

BTW, I suggest that you investigate XL2BB for providing sample data to make it easier for helpers by not having to manually type out sample data to test with.

23 11 16.xlsm
ABCDEFGHIJKLMN
1Jan 2023Feb 2023Mar 2023Apr 2023May 2023Jun 2023Jul 2023Aug 2023Sep 2023Oct 2023Nov 2023Dec 2023
2Project AStatus X10,00010,00010,00010,00010,000
3Project BStatus Y18,00018,00018,00018,00018,00018,00018,000
4Project CStatus X12,00012,00012,00012,000
5Project DStatus X22,00022,00022,00022,00022,00022,00022,00022,00022,00022,00022,000
6
7
8
9StartEndTotal
10Project AMay-23Sep-2350,000
11Project B  0
12Project CSep-23Dec-2348,000
13Project DJan-23Nov-23242,000
Projects
Cell Formulas
RangeFormula
B10:B13B10=IF(XLOOKUP(A10,A$2:A$5,B$2:B$5)="Status X",MINIFS(C$1:N$1,INDEX(C$2:N$5,MATCH(A10,A$2:A$5,0),0),"<>"),"")
C10:C13C10=IF(XLOOKUP(A10,A$2:A$5,B$2:B$5)="Status X",MAXIFS(C$1:N$1,INDEX(C$2:N$5,MATCH(A10,A$2:A$5,0),0),"<>"),"")
D10:D13D10=IF(C10="",0,SUM(FILTER(C$2:N$5,A$2:A$5=A10)))
 
Upvote 0
Thanks for the reply, that worked!

Appreciate the help, the minifs and index/match nesting is great.

As for XL2BB - can't install add-ons to our excel due to sensitive nature of data we access, so stuck with sample screenshots or workbooks. :(
 
Upvote 0
An alternative approach would be to use a 2D Xlookup.
The advantage of this would be that by not relying on Min and Max it would still work if you converted the Table into an actual Excel Table at which point all the date headings would become text and Min/Max would not work without doing a conversion.

Book1
ABCDEFGHIJKLMN
1Jan-23Feb-23Mar-23Apr-23May-23Jun-23Jul-23Aug-23Sep-23Oct-23Nov-23Dec-23
2Project AStatus X1000010000100001000010000
3Project BStatus Y18000180001800018000180001800018000
4Project CStatus X12000120001200012000
5Project DStatus X2200022000220002200022000220002200022000220002200022000
6
7
8
9StartEndTotal
10Project AMay-23Sep-2350000
11Project B  0
12Project CSep-23Dec-2348000
13Project DJan-23Nov-23242000
XLookup 2D
Cell Formulas
RangeFormula
B10:B13B10=XLOOKUP(TRUE,XLOOKUP(1,($A$2:$A$5=$A10)*($B$2:$B$5="Status X"),$C$2:$N$5,"")<>"",$C$1:$N$1,"")
C10:C13C10=XLOOKUP(TRUE,XLOOKUP(1,($A$2:$A$5=$A10)*($B$2:$B$5="Status X"),$C$2:$N$5,"")<>"",$C$1:$N$1,"",0,-1)
D10:D13D10=IF(C10="",0,SUM(FILTER(C$2:N$5,A$2:A$5=A10)))
 
Upvote 0
As for XL2BB - can't install add-ons to our excel
Fair enough. If you start any new threads in the future, state that in post #1 so we don't keep asking you. 😎

so stuck with sample screenshots or workbooks.
If the data is not too big, another option is to simply copy/paste from your Excel to the forum. If you do that you need to explain what range you have posted and also tell us any relevant formulas and where they are. But at least we can copy from that to test whereas we cannot from an image. :)
 
Upvote 0

Forum statistics

Threads
1,215,095
Messages
6,123,072
Members
449,093
Latest member
ripvw

We've detected that you are using an adblocker.

We have a great community of people providing Excel help here, but the hosting costs are enormous. You can help keep this site running by allowing ads on MrExcel.com.
Allow Ads at MrExcel

Which adblocker are you using?

Disable AdBlock

Follow these easy steps to disable AdBlock

1)Click on the icon in the browser’s toolbar.
2)Click on the icon in the browser’s toolbar.
2)Click on the "Pause on this site" option.
Go back

Disable AdBlock Plus

Follow these easy steps to disable AdBlock Plus

1)Click on the icon in the browser’s toolbar.
2)Click on the toggle to disable it for "mrexcel.com".
Go back

Disable uBlock Origin

Follow these easy steps to disable uBlock Origin

1)Click on the icon in the browser’s toolbar.
2)Click on the "Power" button.
3)Click on the "Refresh" button.
Go back

Disable uBlock

Follow these easy steps to disable uBlock

1)Click on the icon in the browser’s toolbar.
2)Click on the "Power" button.
3)Click on the "Refresh" button.
Go back
Back
Top