Hi guys,
I have a huge database, which has a total, cumulated result column. The excel can draw any kind of graph about it, but I would like to know exactly how big is a drawdown.
You know, the drawdown is not the longest decline streak, because many shorter declines can cause the biggest drawdown.
I think it is a common thing, but I culdn't find the answer for it.
So I search a formula for it, or maybe excel has the exact option to show it?
Thank you in advance!
One note: this database is huge (more than 100000 raws)...
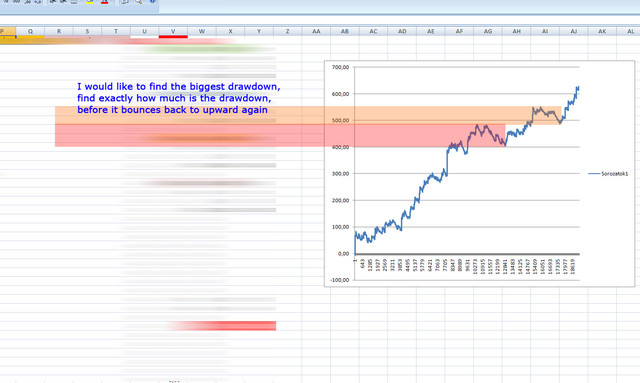
Here it is my graph, and I marked where should be the biggest drawdown:
I have a huge database, which has a total, cumulated result column. The excel can draw any kind of graph about it, but I would like to know exactly how big is a drawdown.
You know, the drawdown is not the longest decline streak, because many shorter declines can cause the biggest drawdown.
I think it is a common thing, but I culdn't find the answer for it.
So I search a formula for it, or maybe excel has the exact option to show it?
Thank you in advance!
One note: this database is huge (more than 100000 raws)...
Here it is my graph, and I marked where should be the biggest drawdown:
Last edited:


