Hi Everyone!
I am trying to graph the following data as a clustered graph. The variables are the same, year, state, and type (unique and recertified)
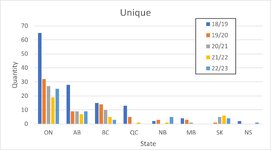
I tried to make a clustered graph by state for each year and the clusters are (unique and recertified) but I couldn't. Can anyone help, please?
I am trying to graph the following data as a clustered graph. The variables are the same, year, state, and type (unique and recertified)
I tried to make a clustered graph by state for each year and the clusters are (unique and recertified) but I couldn't. Can anyone help, please?
| Unique | |||||
| 18/19 | 19/20 | 20/21 | 21/22 | 22/23 | |
| ON | 65 | 32 | 27 | 19 | 25 |
| AB | 28 | 9 | 9 | 7 | 9 |
| BC | 15 | 14 | 10 | 5 | 3 |
| QC | 13 | 5 | 0 | 1 | 0 |
| NB | 2 | 3 | 0 | 1 | 5 |
| MB | 4 | 3 | 1 | 0 | 0 |
| SK | 1 | 5 | 6 | 4 | |
| NS | 2 | 0 | 0 | 0 | 1 |
129 | 67 | 52 | 39 | 47 | |
| recertified | |||||
| 18/19 | 19/20 | 20/21 | 21/22 | 22/23 | |
| ON | 0 | 46 | 64 | 71 | 66 |
| AB | 0 | 18 | 24 | 28 | 31 |
| BC | 0 | 13 | 19 | 30 | 30 |
| QC | 0 | 1 | 9 | 5 | 4 |
| NB | 0 | 2 | 4 | 4 | 4 |
| MB | 0 | 0 | 4 | 5 | 1 |
| SK | 0 | 0 | 0 | 0 | 0 |
| NS | 0 | 2 | 0 | 0 | 1 |
0 | 82 | 124 | 143 | 137 |