Help with percentages in a pivot table and chart

Oddiewan

New Member
Joined
Jan 15, 2024
Messages
1
Office Version
  1. 365
Platform
  1. Windows
I am trying to do a chart from a pivot table.
The data is percentages, for the life of me i cannot get it to show anything.
Hoping someone could identify where i am going wrong, i am sure its looking me in the face......
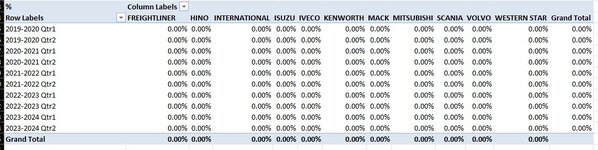
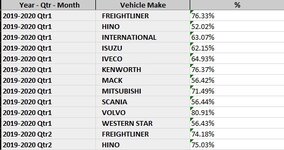
The percentage data is coming from sheet one column G (not a calculated field - just data)
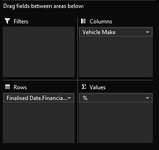
Values in the pivot table are set to Min, have tried Max too and no change
 

Attachments

  • Excel sheet selection.jpg
    Excel sheet selection.jpg
    17.1 KB · Views: 8
  • Excel sheet 5.jpg
    Excel sheet 5.jpg
    182.3 KB · Views: 8
  • Excel sheet 1-1.jpg
    Excel sheet 1-1.jpg
    75.4 KB · Views: 8

Excel Facts

VLOOKUP to Left?
Use =VLOOKUP(A2,CHOOSE({1,2},$Z$1:$Z$99,$Y$1:$Y$99),2,False) to lookup Y values to left of Z values.

Forum statistics

Threads
1,215,069
Messages
6,122,954
Members
449,095
Latest member
nmaske

We've detected that you are using an adblocker.

We have a great community of people providing Excel help here, but the hosting costs are enormous. You can help keep this site running by allowing ads on MrExcel.com.
Allow Ads at MrExcel

Which adblocker are you using?

Disable AdBlock

Follow these easy steps to disable AdBlock

1)Click on the icon in the browser’s toolbar.
2)Click on the icon in the browser’s toolbar.
2)Click on the "Pause on this site" option.
Go back

Disable AdBlock Plus

Follow these easy steps to disable AdBlock Plus

1)Click on the icon in the browser’s toolbar.
2)Click on the toggle to disable it for "mrexcel.com".
Go back

Disable uBlock Origin

Follow these easy steps to disable uBlock Origin

1)Click on the icon in the browser’s toolbar.
2)Click on the "Power" button.
3)Click on the "Refresh" button.
Go back

Disable uBlock

Follow these easy steps to disable uBlock

1)Click on the icon in the browser’s toolbar.
2)Click on the "Power" button.
3)Click on the "Refresh" button.
Go back
Back
Top