Hi - I am very new to advanced conditional formulas in excel trying to build a reusable and fillable Depression Scale excel form. The form has a range of scores that determine the depression severity.
I am stuck at:
Also - I will need your help with the VBA for entering the name and date...as well as for having the data downloaded into the sheet 2
I am stuck at:
- Creating a vlookup/range lookup(?)
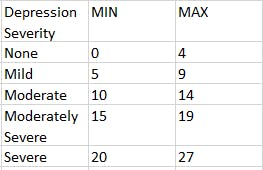
for a range of numbers to determine the severity - my formula in reference to this table is
- Formula: =VLOOKUP(C23:E28,=D24,<=E24,"None",FALSE,=D25,<=E25,"MILD",FALSE, =10,<=14,"MODERATE",FALSE,=D27,<=E27,"MODERATELY SEVERE",FALSE,=20<=27,"SEVERE", FALSE)
| ||||||||||||||||||||||||||
| NAME | DATE | |||||||||||||||||||||||||
| Not at all | Several days | More than half the days | Nearly every day | SCORE | IN SHADED SECTION | |||||||||||||||||||||
| 1 | Little interest or pleasure in doing things | 0 | 1 | 2 | 3 | Answer 1 | 2 | TRUE | ||||||||||||||||||
| 2 | Feeling down, depressed or hopeless | 0 | 1 | 2 | 3 | Answer 2 | 3 | TRUE | ||||||||||||||||||
| 3 | Trouble falling asleep, staying asleep, or sleeping too much | 0 | 1 | 2 | 3 | Answer 3 | 4 | TRUE | ||||||||||||||||||
| 4 | Feeling tired or having little energy | 0 | 1 | 2 | 3 | Answer 4 | 2 | TRUE | ||||||||||||||||||
| 5 | Poor appetite or overeating | 0 | 2 | 3 | Answer 5 | 3 | TRUE | |||||||||||||||||||
| 6 | Feeling bad about yourself - or that you’re a failure or have let yourself or your family down | 0 | 1 | 2 | 3 | Answer 6 | 2 | TRUE | ||||||||||||||||||
| 7 | Trouble concentrating on things, such as reading the newspaper or watching television | 0 | 1 | 2 | 3 | Answer 7 | 2 | TRUE | ||||||||||||||||||
| 8 | Moving or speaking so slowly that other people could have noticed. Or, the opposite - being so fidgety or restless that you have been moving around a lot more than usual | 0 | 1 | 2 | 3 | Answer 8 | 1 | FALSE | ||||||||||||||||||
| 9 | Thoughts that you would be better off dead or of hurting yourself in some way | 0 | 1 | 2 | 3 | Answer 9 | 2 | TRUE | ||||||||||||||||||
| NO. OF ANSWERS IN SHADED SECTION | 8 | |||||||||||||||||||||||||
| ANSWER O Q1 OR Q2 IS IN THE SHADED SECTION | TRUE | |||||||||||||||||||||||||
| RESULT | ||||||||||||||||||||||||||
| DIAGNOSIS | Major Depressive Disorder | |||||||||||||||||||||||||
| TOTAL SCORE | 21 | |||||||||||||||||||||||||
| Depression Severity | #VALUE! | |||||||||||||||||||||||||
| Severity Category | ||||||||||||||||||||||||||
| Total Score | Depression Severity | MIN | MAX | |||||||||||||||||||||||
| None | 0 | 4 | ||||||||||||||||||||||||
| Mild | 5 | 9 | ||||||||||||||||||||||||
| Moderate | 10 | 14 | ||||||||||||||||||||||||
| Moderately Severe | 15 | 19 | ||||||||||||||||||||||||
| Severe | 20 | 27 |
Also - I will need your help with the VBA for entering the name and date...as well as for having the data downloaded into the sheet 2


