HarryFröhlich
Board Regular
- Joined
- Mar 25, 2003
- Messages
- 116
Hi everybody!
I would like to pick your brains, please...
The background: At the end of each month, consultants provide me with a spreadsheet that contains the following data in columns:
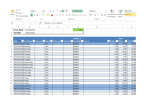
1. The name of the client for whom they did work on any given/specific day (let's assume the name is typed in column A). If a consultant saw the client on the 2nd, 10th and 23rd of a month, it follows that the name of the client will show 3 times. If he saw another client 5 times, the client's name will show 5 times etc. Any one or all of 30 clients may be seen.
2. The number of hours that they spent with the client (let's assume that this is indicated in column B)
3. And lastly, whether the hours spent with the client is billable or non-billable. (let's assume that this is indicated in column C)
An example:
Workbook name = "Peter time sheet data March 2020.xlsx"
A1 (Heading)= Client name
B1 (Heading)=Hours spent
C1 (Heading)=Billable or Non-Billable
Actual data:
A2 = ABC
B2 = 1.5
C= Billable
There are 20 consultants who provide me with their time sheets...
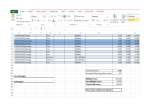
At the end of the month in question, I have to calculate the billable and non-billable hours spent with each client for each of the consultants and then carry these hours over to a separate recon workbook for each consultant and for each client. Let's call this workbook "Recon workbook March 2020.xlsx". This workbook summarises the time that each of the 20 consultants spent with each of the 30 clients. The names of the consultants appear below one another in rows down column A while the names of the 30 clients appear in columns B, C, D etc... Let's assume Peter's name shows in cell A7 and client ABC in column C.
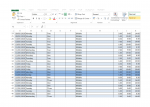
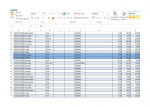
What I currently do is to to open a workbook of a consultant (let's assume that I start with Peter's workbook above). I then use a filter in column A to pick each client one by one in column A. In my Example let's assume that client ABC shows up 3 times. All other clients will be hidden. I now check if the hours are billable or non-billable. I then filter for that if some are billable and some are not. Let's assume all are billable. Once that is done, I highlight the hours in column B with my mouse and look at the right lower section of Excel what the Sum value of the highlighted range is. I then write this value down and copy these hours to the recon workbook. In my example above, the hours that Peter had spent with client ABC will be entered in cell C7.
I am really hopeful that someone will be able to help me automate this tedious task with VBA...
To summarise,
1. there are 20 consultants whose workbooks all have different names to identify their own time sheets (say peter)
2. each consultant's workbook changes with the name of the new month for which the hours are captured (say March 2020)
3. Each consultant's workbook only includes data of a single month
4. Each workbook could include time spent with a single client or up to 30 clients and the time spent for each client has to be calculated from the spreadsheet
5. The values for each consultant is to be carried over to the recon spreadsheet (for the relevant month, say March) for each respective client. If Peter saw 5 clients (ABC 19 hours, BCD 26 hours, CDE 27 hours, DEF 28 hours and EFG 29.5 hours), the hours spent with each client has to be transferred to each corresponding column in the recon spreadsheet against Peter's name in the recon spreadsheet.
Did I make sense? hehe I really hope so...
And I also hope someone will come up with a great plan!
Kind regards
Harry


