How to pull data from an exponential trendline chart automatically to a cell.

duken58

New Member
Joined
Jan 11, 2022
Messages
1
Office Version
  1. 365
Platform
  1. Windows
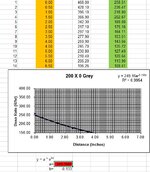
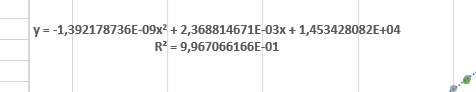
I have an exponential trendline in a chart using two rows of data. Per the mini-sheet or the attached picture (the only place to see my graph), the orange column is my X axis and my green column is my Y axis. The exponential trendline gives me an equation of y = 249.16e-0.133x & R² = 0.9954. I want to be able to have a cell in the sheet automatically pull my a value (249.16 from the previous chart equation) from the chart formula. Is there a way to do this? Our sheet is setup so whenever we change the date of the sheet it changes our graph equation. Whatever this a value changes to we currently have to manually type into our cell for the rest of our spreadsheet to auto adjust based on the new values. Or does anyone know how excel calculates the exponential trendline equation to where I could have it typed in a cell and pull the data from the cell if it's easy than the chart? Thanks for any help. Just trying to automate the process.


CAL2001HP Grey 2022.xlsx
ABCDEFG
1210.00468.00258.51
1320.50428.10236.47
1431.00396.10218.80
1541.50366.90202.67
1652.00342.30189.08
1762.50317.10175.16
1873.00297.10164.11
1983.50277.90153.51
2094.00259.90143.56
21104.50245.70135.72
22115.00230.80127.49
23125.50218.40120.64
24136.00206.20113.90
25146.50196.26108.41
26
27y = a * ebx
28a=249.1645
29b=-0.133
200-0
Cell Formulas
RangeFormula
G12:G25G12=E12*(EXP(-0.6931*((DATEVALUE($F$5)-DATEVALUE($F$4))/365)/30.1))
 

Attachments

  • Exponential Help.JPG
    Exponential Help.JPG
    89.6 KB · Views: 23

Excel Facts

Copy PDF to Excel
Select data in PDF. Paste to Microsoft Word. Copy from Word and paste to Excel.
I did that once with VBA, read the label which i previous changed in scientific format with 9 digits
VBA Code:
              s =Sheets("sheet1").ChartObjects("GrafiekTest").Chart.FullSeriesCollection(tr).Trendlines(1).DataLabel.Text
               s = Replace(Replace(Replace(Replace(s, "+ ", "+"), "- ", "-"), Chr(11), " "), " =", "=")
               sp = Split(s)
               ReDim a(UBound(sp), 2)
               For i = 0 To UBound(sp)
                    a(i, 0) = sp(i)
                    sp1 = Split(sp(i), "E")
                    If UBound(sp1) = 1 Then
                         a(i, 1) = "'" & sp1(0)
                         a(i, 2) = Mid(sp1(1), 1, 3)
                    End If
               Next
               .Range("K72").Resize(UBound(a) + 1, 3) = a

Your label 'll be a little bit different as it's an exponential curve.
The question is how much different ?

forum.xlsb
KLMN
72y=
73-1,392178736E-09x2-1,392178736-9-1,39218E-09
74+2,368814671E-03x+2,368814671-30,002368815
75+1,453428082E+04+1,453428082414534,28082
76R²=
779,967066166E-019,967066166-10,996706617
Sheet1
Cell Formulas
RangeFormula
N73:N75,N77N73=+L73*POWER(10,M73)
 

Attachments

  • Schermafbeelding 2022-01-12 020931.png
    Schermafbeelding 2022-01-12 020931.png
    4.8 KB · Views: 14
Last edited:
Upvote 0
Solution
VBA Code:
Sub Exponentional_Trend()
     Set sh = Sheets("blad2")                                   'your sheet
     Set chrt = sh.ChartObjects(1).Chart                        'your chart
     Set sr = chrt.FullSeriesCollection(1)                      'the wanted serie and trendline
     With sr.Trendlines(1).DataLabel                            'the datalabel
          .NumberFormat = "0,000000000E+00"                     'extra digits
          s = .Text                                             'read label
     End With

     s = Replace(Replace(Replace(Replace(Replace(Replace(Replace(s, "+ ", "+"), "- ", "-"), Chr(11), " "), " =", "="), "e", " ", , , 0), ",", "."), "x", "")     'modify a little
     sp = Filter(Filter(Split(s), "R", 0), "y", 0)              'split on the spaces and get rid of annoying parts
     MsgBox Join(sp, vbLf)
     sh.Range("Q1").Resize(UBound(sp) + 1) = Application.Transpose(sp)     'your 3 parts
End Sub
 
Upvote 0

Forum statistics

Threads
1,215,681
Messages
6,126,194
Members
449,298
Latest member
Jest

We've detected that you are using an adblocker.

We have a great community of people providing Excel help here, but the hosting costs are enormous. You can help keep this site running by allowing ads on MrExcel.com.
Allow Ads at MrExcel

Which adblocker are you using?

Disable AdBlock

Follow these easy steps to disable AdBlock

1)Click on the icon in the browser’s toolbar.
2)Click on the icon in the browser’s toolbar.
2)Click on the "Pause on this site" option.
Go back

Disable AdBlock Plus

Follow these easy steps to disable AdBlock Plus

1)Click on the icon in the browser’s toolbar.
2)Click on the toggle to disable it for "mrexcel.com".
Go back

Disable uBlock Origin

Follow these easy steps to disable uBlock Origin

1)Click on the icon in the browser’s toolbar.
2)Click on the "Power" button.
3)Click on the "Refresh" button.
Go back

Disable uBlock

Follow these easy steps to disable uBlock

1)Click on the icon in the browser’s toolbar.
2)Click on the "Power" button.
3)Click on the "Refresh" button.
Go back
Back
Top