All,
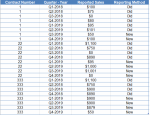
I am at a loss... Basically, we just need to identify the contracts where the change in reporting systems caused a likely error in total QUARTERLY reporting (to include all product ID's) and when it occurred.
I'm having a hard time identifying the best way to run this data and to even the best way to show it. I am trying to find a way to identify contracts where the transition from the old to new reporting method resulted in an unusual variance (for instance a 20% increase/decrease) from the MEDIAN previously reported TOTALS per quarter. Median seems like the best method since there are many quarters with $0 sales and that is no help. Everything in gray below I am at a loss as to how to identify. It would be great if I could present the change in reporting system on a chart and show visually if there is a spike or drop in the next quarter but there are literally thousands of contracts so that doesn't seem like the best way.
I would appreciate any ideas as to how to best run and present this.