Is Take() the best way to calculate a moving sum?

JenniferMurphy

Well-known Member
Joined
Jul 23, 2011
Messages
2,534
Office Version
  1. 365
Platform
  1. Windows
About a week ago, Cubist introduced me to the Take function. I have made great use of it.

I just had a situation where I needed to calculate a moving average. The Take function seems like the perfect solution, but I would appreciate any comments.

Here are several examples. The mini-sheet is below.

1712368755353.png
1712368791008.png
1712368855608.png
1712369024144.png


Notice that I can't easily get the moving average from the moving sum without calculating the number of values in the sum, something that Take does for me.

Take Function.xlsx
CDE
5N=5
6ValueSum of Last NAverage of Last N
7333.00
8694.50
91103.33
107174.25
113204.00
121183.60
132142.80
145183.60
153142.80
168193.80
Moving Sum
Cell Formulas
RangeFormula
D7:D16D7=SUM(TAKE(OFFSET(Table2[[#Headers],[Value]],1,0):[@Value],-Num))
E7:E16E7=AVERAGE(TAKE(OFFSET(Table2[[#Headers],[Value]],1,0):[@Value],-Num))
Named Ranges
NameRefers ToCells
'Moving Sum'!Num='Moving Sum'!$C$5D7:E16
 

Excel Facts

Which came first: VisiCalc or Lotus 1-2-3?
Dan Bricklin and Bob Frankston debuted VisiCalc in 1979 as a Visible Calculator. Lotus 1-2-3 debuted in the early 1980's, from Mitch Kapor.
Happy to help. For your consideration, a few other approaches. The orange cells form the range to use using the same DROP/TAKE methodology described earlier, but we need to know which row index we're on, so ridx is a named variable that relies on the row number of the worksheet and the row number where the column header is found to create row indexes of 1, then 2, and so on.

The green cells use a more conventional INDEX approach, but the rows to use are specified by the SEQUENCE function, which starts at the current row index and goes backward some number of rows.

I still think my preference is a LAMBDA...the pink cells use the MAP helper LAMBDA function, and in it, the row indexes are created using the SEQUENCE function. We step along each row index (called r inside the LAMBDA function...an arbitrary designation)...and use the same DROP/TAKE method for efficiently selecting the desired portion of the data range. This is a variation on the earlier LAMBDA approach...a bit shorter and still only one formula to spill the results.
MrExcel_20240405.xlsx
CDEFGHI
55
6ValueSum of Last NAverage of Last NSum of Last NAverage of Last NSum of Last NAverage of Last N
733.003.003.003.003.003.00
869.004.509.004.509.004.50
9110.003.3310.003.3310.003.33
10717.004.2517.004.2517.004.25
11320.004.0020.004.0020.004.00
12118.003.6018.003.6018.003.60
13214.002.8014.002.8014.002.80
14518.003.6018.003.6018.003.60
15314.002.8014.002.8014.002.80
16819.003.8019.003.8019.003.80
Moving Sum
Cell Formulas
RangeFormula
D7:D16D7=LET(ridx,ROW()-ROW(Table2[#Headers]),SUM(DROP(TAKE(Table2[Value],ridx),MAX(0,ridx-Num))))
E7:E16E7=LET(ridx,ROW()-ROW(Table2[#Headers]),AVERAGE(DROP(TAKE(Table2[Value],ridx),MAX(0,ridx-Num))))
F7:F16F7=LET(ridx,ROW()-ROW(Table2[#Headers]),SUM(INDEX(Table2[Value],SEQUENCE(MIN(ridx,Num),,ridx,-1))))
G7:G16G7=LET(ridx,ROW()-ROW(Table2[#Headers]),AVERAGE(INDEX(Table2[Value],SEQUENCE(MIN(ridx,Num),,ridx,-1))))
H7:H16H7=MAP(SEQUENCE(ROWS(Table2)),LAMBDA(r,SUM(DROP(TAKE(Table2[Value],r),MAX(0,r-Num)))))
I7:I16I7=MAP(SEQUENCE(ROWS(Table2)),LAMBDA(r,AVERAGE(DROP(TAKE(Table2[Value],r),MAX(0,r-Num)))))
Dynamic array formulas.
Named Ranges
NameRefers ToCells
Num='Moving Sum'!$C$5H7:I7, D7:G16
 
Upvote 0
Solution
Happy to help. For your consideration, a few other approaches. The orange cells form the range to use using the same DROP/TAKE methodology described earlier, but we need to know which row index we're on, so ridx is a named variable that relies on the row number of the worksheet and the row number where the column header is found to create row indexes of 1, then 2, and so on.

The green cells use a more conventional INDEX approach, but the rows to use are specified by the SEQUENCE function, which starts at the current row index and goes backward some number of rows.

I still think my preference is a LAMBDA...the pink cells use the MAP helper LAMBDA function, and in it, the row indexes are created using the SEQUENCE function. We step along each row index (called r inside the LAMBDA function...an arbitrary designation)...and use the same DROP/TAKE method for efficiently selecting the desired portion of the data range. This is a variation on the earlier LAMBDA approach...a bit shorter and still only one formula to spill the results.
Wow! 🤔😯 That is amazing and very helpful. It will give something to study. Thank you.

I'm going to mark this as the solution. Even though my original solution works, these additional solutions have other advantages.
 
Upvote 0
Thanks...these others avoid OFFSET to form the array of interest. but nothing really wrong with the original ideas either. Once any of these are applied to a larger data set, I'm curious about whether you notice any performance changes. Let me know if I might be able to clarify anything with the LAMBDAs.
 
Upvote 0
We may be talking apples and oranges here. I am not trying to "move 5 averages". I'm not even sure what that means.

I am using the definition of a "simple moving average" as defined in several sources. Here are just two:


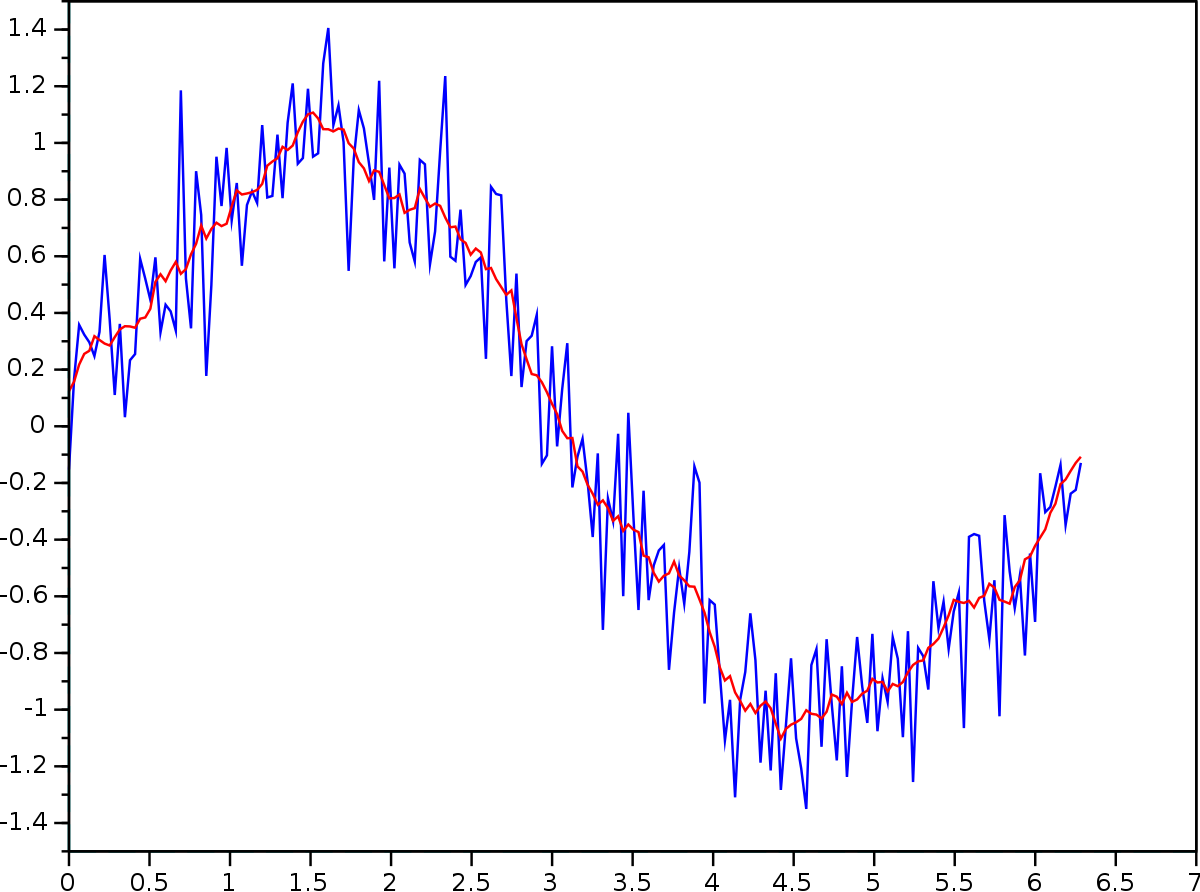
In my solution, a simple moving average of length N, is the simple average of the last N values. But if there are less than N values, then it's the average of as many values as there are. For the first N-1,values the moving average is the simple average of a many values as there are. As you can see in my examples, the moving average of the first value is just that value. The moving average of the first 2 values is the sum of those values divided by 2. And so on.

Now there are other types of moving averages, such as weighted and exponential. These take into account more values and they have different uses.
Did you look at the formula from the Wiki page you linked? The definition: "simple moving average (SMA) is the unweighted mean of the previous k data points."
When there are not enough k points, it's not a moving average. By definition, the first 4 averages in your example are not moving averages. But if that's what your intent is for your purpose that is fine.
Screen Shot 2024-04-06 at 6.38.37 AM.png

In your example, there are 10 data points (n=10), and the moving 5 average (k=5). The first data point is determined by
i = n-k+1 or i = 10-5+1 = 6. There is a reason the index didn't start from 1 because it would make it a simple average not a moving average. I'm not trying to be overly pedantic. Just so you're aware someone with a technical background might call you out on that.
 
Last edited:
Upvote 0
Did you look at the formula from the Wiki page you linked? The definition: "simple moving average (SMA) is the unweighted mean of the previous k data points."
When there are not enough k points, it's not a moving average. By definition, the first 4 averages in your example are not moving averages. But if that's what your intent is for your purpose that is fine.
View attachment 109586
In your example, there are 10 data points (n=10), and the moving 5 average (k=5). The first data point is determined by
i = n-k+1 or i = 10-5+1 = 6. There is a reason the index didn't start from 1 because it would make it a simple average not a moving average. I'm not trying to be overly pedantic. Just so you're aware someone with a technical background might call you out on that.

I think my point is stated in this paragraph from the Wiki article:
During the initial filling (emphasis mine) of the FIFO / circular buffer the sampling window is equal to the data-set size thus, k=n, and the average calculation is performed as a cumulative moving average.

I think this is saying that when the number of values is less than the intended sample size, the moving average is the average of however many values there are. The moving average of the 1st value is that value. The moving average of the first 2 values is the sum of those 2 values divided by 2. And so on until the intended average length is achieved. I agree that the first n-1 moving averages have less "validity?" than those with the full n values. But then they are probably not relied on much either. The alternative would be to show no values at all for the moving average until n values are present.
 
Upvote 0
I have been playing with the various solutions offered here and am grateful for all contributions. The solution I have come up with for my current need is in the minisheet below. This solution eliminates the use of Offset.

Here are a couple of sample results. The number in the yellow cell is the number of values in the moving average.

1713148708328.png
1713148786788.png


Moving Totals.xlsx
CDEF
3 4Number of rows
4
5DateValueSumAverage
61/01/24222.00
71/02/24463.00
81/03/24393.00
91/04/245143.50
101/05/241133.25
111/06/24092.25
121/07/24282.00
131/08/247102.50
141/09/243123.00
151/10/242143.50
Sheet1
Cell Formulas
RangeFormula
E6:E15E6=SUM(TAKE(Table1[[#Headers],[Value]]:[@Value],-NumRows))
F6:F15F6=AVERAGE(TAKE(Table1[[#Headers],[Value]]:[@Value],-NumRows))
Named Ranges
NameRefers ToCells
NumRows=Sheet1!$D$3E6:F15
 
Upvote 0

Forum statistics

Threads
1,215,200
Messages
6,123,611
Members
449,109
Latest member
Sebas8956

We've detected that you are using an adblocker.

We have a great community of people providing Excel help here, but the hosting costs are enormous. You can help keep this site running by allowing ads on MrExcel.com.
Allow Ads at MrExcel

Which adblocker are you using?

Disable AdBlock

Follow these easy steps to disable AdBlock

1)Click on the icon in the browser’s toolbar.
2)Click on the icon in the browser’s toolbar.
2)Click on the "Pause on this site" option.
Go back

Disable AdBlock Plus

Follow these easy steps to disable AdBlock Plus

1)Click on the icon in the browser’s toolbar.
2)Click on the toggle to disable it for "mrexcel.com".
Go back

Disable uBlock Origin

Follow these easy steps to disable uBlock Origin

1)Click on the icon in the browser’s toolbar.
2)Click on the "Power" button.
3)Click on the "Refresh" button.
Go back

Disable uBlock

Follow these easy steps to disable uBlock

1)Click on the icon in the browser’s toolbar.
2)Click on the "Power" button.
3)Click on the "Refresh" button.
Go back
Back
Top