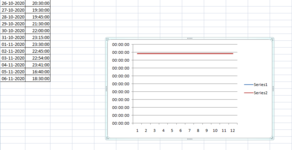
Issue with Graph in excel

Gautham A

Board Regular
Joined
May 25, 2020
Messages
107
Office Version
  1. 2016
Platform
  1. Windows
Hi Team,

Using the following data, I'm trying to plot a line graph with time on y axis and date on x axis. All I'm getting is a single horizontal line. Not sure what to do. Can someone help me on this?

26-10-2020​
20:30:00​
27-10-2020​
19:30:00​
28-10-2020​
19:45:00​
29-10-2020​
21:30:00​
30-10-2020​
22:00:00​
31-10-2020​
23:15:00​
01-11-2020​
23:30:00​
02-11-2020​
22:45:00​
03-11-2020​
22:54:00​
04-11-2020​
23:41:00​
05-11-2020​
16:40:00​
06-11-2020​
18:30:00​
 

Attachments

  • graph.PNG
    graph.PNG
    19.7 KB · Views: 10

Excel Facts

Is there a shortcut key for strikethrough?
Ctrl+S is used for Save. Ctrl+5 is used for Strikethrough. Why Ctrl+5? When you use hashmarks to count |||| is 4, strike through to mean 5.

Forum statistics

Threads
1,216,075
Messages
6,128,668
Members
449,463
Latest member
Jojomen56

We've detected that you are using an adblocker.

We have a great community of people providing Excel help here, but the hosting costs are enormous. You can help keep this site running by allowing ads on MrExcel.com.
Allow Ads at MrExcel

Which adblocker are you using?

Disable AdBlock

Follow these easy steps to disable AdBlock

1)Click on the icon in the browser’s toolbar.
2)Click on the icon in the browser’s toolbar.
2)Click on the "Pause on this site" option.
Go back

Disable AdBlock Plus

Follow these easy steps to disable AdBlock Plus

1)Click on the icon in the browser’s toolbar.
2)Click on the toggle to disable it for "mrexcel.com".
Go back

Disable uBlock Origin

Follow these easy steps to disable uBlock Origin

1)Click on the icon in the browser’s toolbar.
2)Click on the "Power" button.
3)Click on the "Refresh" button.
Go back

Disable uBlock

Follow these easy steps to disable uBlock

1)Click on the icon in the browser’s toolbar.
2)Click on the "Power" button.
3)Click on the "Refresh" button.
Go back
Back
Top