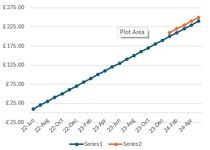
Hi all. I'm trying to set up a basic line graph which shows my cumulative pension amount, which starts from June '22 until now. I didn't start tracking the pension value monthly until Jan '24. When I add the pension value to the graph it automatically starts from the same date as the cumulative data. How do I get it to start on the graph from Jan 24?
-
If you would like to post, please check out the MrExcel Message Board FAQ and register here. If you forgot your password, you can reset your password.
Line Graph query
- Thread starter misterzim
- Start date
Similar threads
- Question


