Hi, I'd really appreciate any suggestions on how best to manipluate the datasheet for a sales pipeline dashboard to enable me to report on sales prospects over time. I specifically want to be able to report on the number and value of sales leads in the pipeline at any point in time, by sales stage. And to compare that between periods. E.g. how many active sales leads do we have in the pipeline for Q1 2023 vs Q1 2022.
There are several sales stages e.g. 0_Early_Stage_Prospecting, 1.Requirements&Quote, 2.SubmittedforApproval, 3.Approved, 4.NotApproved, 5.ProposaltoClient25, 5.ProposaltoClient50, 6.NegotiationFinalStage, 7.Sold, 8.Contracted, 9.QuoteRejected
Right now the data is structured so that each sales opportunity is a row in a spreadsheet and it includes the date it entered the sales pipeline and then the number of days at each of the sales stages.
I can't work out how to manipulate the data to put it into a structure that then allows comparison reporting from one period to another, or at any point in time.
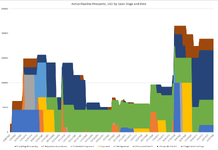
In the mini sheet, I've given an example of what the data looks like from our sales pipeline. I've included 20 dummy rows of data. In the attached image I've included a mocked-up example of one way we might want to report on the data if I can get it into the right format i.e. a stacked area chart showing the value in USD of the sales opportunity by sales stage and date.
Many thanks indeed for any advice.
There are several sales stages e.g. 0_Early_Stage_Prospecting, 1.Requirements&Quote, 2.SubmittedforApproval, 3.Approved, 4.NotApproved, 5.ProposaltoClient25, 5.ProposaltoClient50, 6.NegotiationFinalStage, 7.Sold, 8.Contracted, 9.QuoteRejected
Right now the data is structured so that each sales opportunity is a row in a spreadsheet and it includes the date it entered the sales pipeline and then the number of days at each of the sales stages.
I can't work out how to manipulate the data to put it into a structure that then allows comparison reporting from one period to another, or at any point in time.
In the mini sheet, I've given an example of what the data looks like from our sales pipeline. I've included 20 dummy rows of data. In the attached image I've included a mocked-up example of one way we might want to report on the data if I can get it into the right format i.e. a stacked area chart showing the value in USD of the sales opportunity by sales stage and date.
Many thanks indeed for any advice.
| Sales pipeline data example.xlsx | |||||||||||||||||||
|---|---|---|---|---|---|---|---|---|---|---|---|---|---|---|---|---|---|---|---|
| A | B | C | D | E | F | G | H | I | J | K | L | M | N | O | P | Q | |||
| 2 | prospect_no | creation_Date | company | project_name | currency | prospect_revenue | days_in_0.EarlyStageProspecting | days_in_1.RequirementsampQuote | days_in_2.SubmittedforApproval | days_in_3.Approved | days_in_4.NotApproved | days_in_5.ProposaltoClient25 | days_in_5.ProposaltoClient50 | days_in_6.NegotiationFinalStage | days_in_7.Sold | days_in_8.Contracted | days_in_9.QuoteRejected | ||
| 3 | 419 | 2023-04-27 | Company 1 | Project 1 | USD | 15000 | 18 | 0 | 0 | 0 | 0 | 0 | 0 | 0 | 0 | 0 | 0 | ||
| 4 | 418 | 2023-03-26 | Company 2 | Project 2 | USD | 100000 | 8 | 0 | 3 | 12 | 0 | 0 | 27 | 0 | 0 | 0 | 0 | ||
| 5 | 417 | 2023-03-24 | Company 3 | Project 3 | USD | 23580 | 0 | 2 | 0 | 0 | 2 | 0 | 9 | 39 | 0 | 0 | 0 | ||
| 6 | 416 | 2023-02-24 | Company 4 | Project 4 | USD | 17000 | 0 | 8 | 0 | 0 | 0 | 0 | 23 | 15 | 0 | 0 | 34 | ||
| 7 | 415 | 2023-02-24 | Company 5 | Project 5 | USD | 24125 | 0 | 10 | 0 | 10 | 0 | 10 | 15 | 10 | 25 | 0 | 0 | ||
| 8 | 414 | 2023-01-21 | Company 6 | Project 6 | USD | 3000 | 0 | 0 | 0 | 0 | 0 | 0 | 3 | 0 | 111 | 0 | 0 | ||
| 9 | 413 | 2023-01-18 | Company 7 | Project 7 | USD | 2000 | 9 | 0 | 0 | 0 | 0 | 0 | 2 | 5 | 0 | 0 | 101 | ||
| 10 | 412 | 2023-01-17 | Company 8 | Project 8 | USD | 7536 | 17 | 0 | 0 | 20 | 0 | 15 | 0 | 0 | 15 | 51 | 0 | ||
| 11 | 411 | 2023-01-06 | Company 9 | Project 9 | USD | 4535 | 0 | 2 | 2 | 0 | 0 | 10 | 0 | 2 | 7 | 106 | 0 | ||
| 12 | 410 | 2023-01-06 | Company 10 | Project 10 | USD | 15000 | 0 | 9 | 0 | 0 | 0 | 120 | 0 | 0 | 0 | 0 | 0 | ||
| 13 | 409 | 2022-12-05 | Company 11 | Project 11 | USD | 9000 | 0 | 0 | 0 | 0 | 0 | 0 | 17 | 0 | 21 | 123 | 0 | ||
| 14 | 408 | 2022-12-04 | Company 12 | Project 12 | USD | 5250 | 0 | 1 | 0 | 0 | 0 | 0 | 28 | 10 | 4 | 119 | 0 | ||
| 15 | 407 | 2022-11-04 | Company 13 | Project 13 | USD | 10615 | 0 | 5 | 2 | 0 | 0 | 8 | 8 | 4 | 3 | 162 | 0 | ||
| 16 | 406 | 2022-11-03 | Company 14 | Project 14 | USD | 10150 | 0 | 2 | 0 | 0 | 0 | 0 | 29 | 0 | 0 | 162 | 0 | ||
| 17 | 405 | 2022-11-03 | Company 15 | Project 15 | USD | 50000 | 0 | 2 | 0 | 0 | 0 | 0 | 29 | 0 | 0 | 193 | 0 | ||
| 18 | 404 | 2022-10-03 | Company 16 | Project 16 | USD | 24900 | 0 | 2 | 0 | 10 | 0 | 14 | 20 | 0 | 14 | 164 | 0 | ||
| 19 | 402 | 2022-09-15 | Company 17 | Project 17 | USD | 70750 | 0 | 2 | 13 | 0 | 15 | 0 | 11 | 0 | 4 | 197 | 0 | ||
| 20 | 401 | 2022-09-14 | Company 18 | Project 18 | USD | 15500 | 0 | 2 | 0 | 0 | 0 | 0 | 29 | 0 | 35 | 177 | 0 | ||
| 21 | 400 | 2022-09-01 | Company 19 | Project 19 | USD | 45800 | 35 | 5 | 0 | 14 | 0 | 202 | 0 | 0 | 0 | 0 | 0 | ||
| 22 | 399 | 2022-08-29 | Company 20 | Project 20 | USD | 17400 | 0 | 0 | 0 | 0 | 0 | 0 | 1 | 34 | 34 | 190 | 0 | ||
| 23 | Etc, several hundred rows | ||||||||||||||||||
Data Extract | |||||||||||||||||||