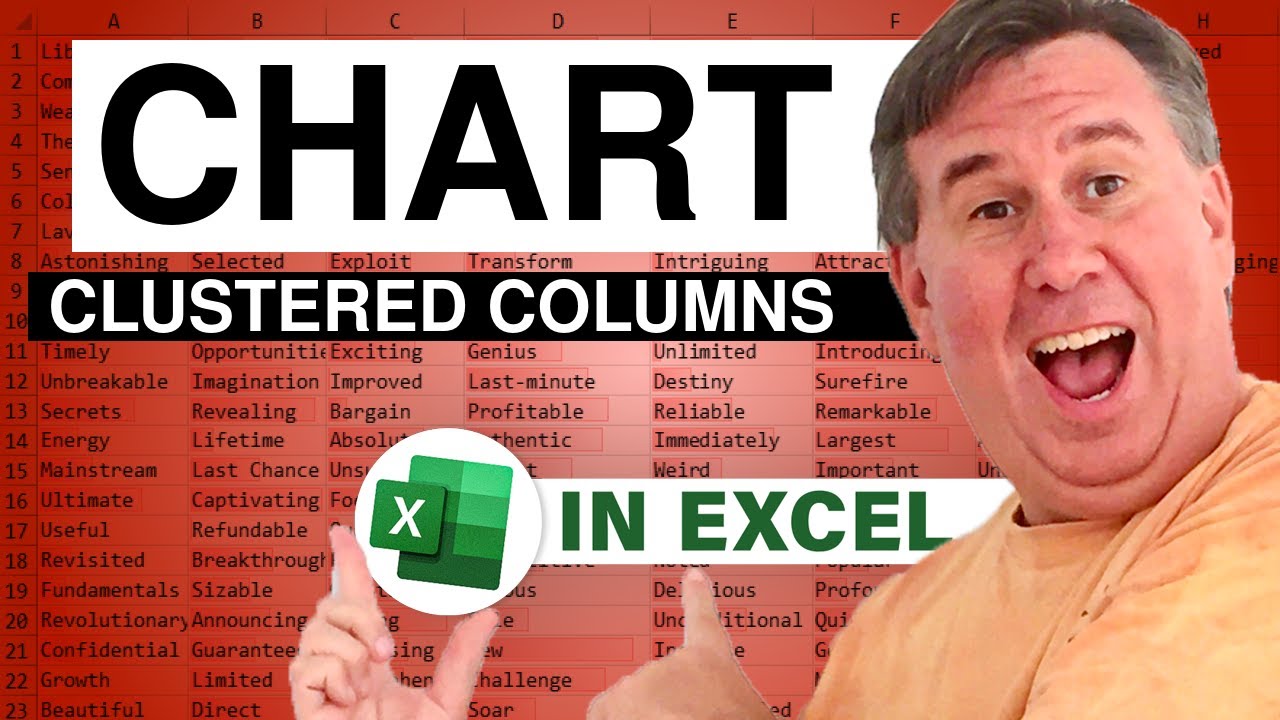
Rodney asks how Excel can make a clustered column chart. While it is not immediately obvious, it is relatively easy to do. Episode 666 shows you how.
This blog is the video podcast companion to the book, Learn Excel 97-2007 from MrExcel. Download a new two minute video every workday to learn one of the 377 tips from the book!
This blog is the video podcast companion to the book, Learn Excel 97-2007 from MrExcel. Download a new two minute video every workday to learn one of the 377 tips from the book!
Transcript of the video:
Hey, welcome back to the MrExcel netcast. I'm Bill Jelen.
Well today we have a question sent in by Rodney. Now Rodney's in high school.
He says hey, I have a science project here I have a couple of different areas that I want to chart.
I have X and Y values.
I have A B and C trials and i have trial 1 and trial 2.
I need to get that all on a single stacked column chart.
He said he was trying to create something that looked a little bit like this chart here and said I can't figure out any way to make excel do that.
Well we can do it it's just a little bit tough.
What you have to do is take the data and insert blank rows between the A Section the B section and the C section.
So I have these extra Blank rows here.
And then we're going to go through and insert a chart.
I'm going to use the stacked column chart.
We'll just click finish, and you'll see that initially, it's not obvious that the A's are together, the B's are together, but what we're going to do is right click on one of the bars, "Format Data Series" and go back to the "Options" tab.
On the "Options" tab, we're going to change the gap with this is a great little setting where I set it back to zero that will cause the columns to all touch each other except for here, where we have the blank cells in between.
So it works out great, now at this point of course if you need to add the numbers in "Format Data series" go to "Data Labels" and add a value.
We'll have to do that for both series.
Both the X and the Y series.
"Format Data Series" add "Value", and you're good to go.
So Rodney, I'm sure you're going back to school.
Today is Monday, hopefully this is in time for your science project, but you can do it in excel.
Not intuitively obvious, you have to do a little tweaking there, but it works out.
Thanks to you for stopping by. We'll see you next time for another netcast from MrExcel.


