So, I am looking for a way to dynamically figure out how to distribute a prize fund based on certain user-defined variables. I stumbled across this thread which started down the path but I'm curious if what I'm trying to accomplish is feasible within the Excel framework.
The application is for a bowling tournament where the total number of entrants will determine the number of participants who receive a prize at the conclusion.
Here is the data the end user will provide:
Total number of participants
Entry fee
Portion of entry fee used to determine prize fund (The center takes a portion of the entry fee for providing the location)
Total number of prize recipients (This number is determined by dividing the number of participants by a user-defined number, typically between 3 and 8)
Percentage of prize fund allocated to first place
Constraint - No participant can receive a prize less than the entry fee and the prize fund is to be returned in full.
I would like for the spreadsheet to calculate the remainder of the prize fund once all data is entered. Ideally, the prize fund would reward higher places with a larger prize and scale down until the minimum allowable prize is reached. It is acceptable for multiple participants at the bottom of the prize list to receive an equal amount but would like to reward higher finishers with larger prizes, even if only incrementally.
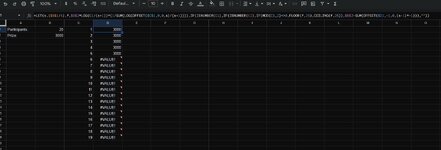
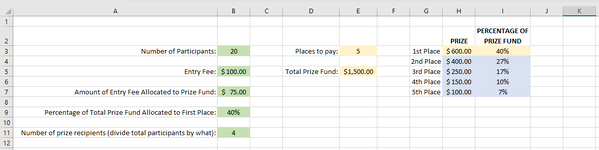
The attached photo is a SIMPLE example of what I'm looking to accomplish. The values in column B (shaded light green) are entered by the user. The values in the yellow-shaded cells are formula derived. The cells shaded in blue are the ones I would like for Excel to dynamically calculate any time the user changes the value in any green-shaded cell.
Currently the blue-shaded cells have values that I would be comfortable with Excel dynamically generating, but are not beholden to those percentages.
I will be glad to provide additional details as necessary. Thanks in advance for taking on this project!
The application is for a bowling tournament where the total number of entrants will determine the number of participants who receive a prize at the conclusion.
Here is the data the end user will provide:
Total number of participants
Entry fee
Portion of entry fee used to determine prize fund (The center takes a portion of the entry fee for providing the location)
Total number of prize recipients (This number is determined by dividing the number of participants by a user-defined number, typically between 3 and 8)
Percentage of prize fund allocated to first place
Constraint - No participant can receive a prize less than the entry fee and the prize fund is to be returned in full.
I would like for the spreadsheet to calculate the remainder of the prize fund once all data is entered. Ideally, the prize fund would reward higher places with a larger prize and scale down until the minimum allowable prize is reached. It is acceptable for multiple participants at the bottom of the prize list to receive an equal amount but would like to reward higher finishers with larger prizes, even if only incrementally.
The attached photo is a SIMPLE example of what I'm looking to accomplish. The values in column B (shaded light green) are entered by the user. The values in the yellow-shaded cells are formula derived. The cells shaded in blue are the ones I would like for Excel to dynamically calculate any time the user changes the value in any green-shaded cell.
Currently the blue-shaded cells have values that I would be comfortable with Excel dynamically generating, but are not beholden to those percentages.
I will be glad to provide additional details as necessary. Thanks in advance for taking on this project!
")