Scatter chart with multiple sections

IanPM

Board Regular
Joined
Dec 12, 2013
Messages
53
I need help with expanding a scatter chart

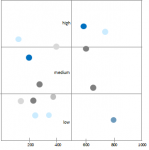
I need to make a scatter chart graph with multiple areas as per below example where the vertical axis is allocated to specified point against horizontal axis

Vertical plot is based on percentage growth where the plots are then in blocks of high, medium & low depending on the percentage growth.
Horizontal plot is based on profit

Examples:

Red plot point
Growth = 25%
Allocation block = High
Profit = 600

Green plot point
Growth = 3%
Allocation block = Low
Profit = 800


1576070692352.png
 

Attachments

  • 1576070462388.png
    1576070462388.png
    5.6 KB · Views: 3

Excel Facts

Lock one reference in a formula
Need 1 part of a formula to always point to the same range? use $ signs: $V$2:$Z$99 will always point to V2:Z99, even after copying

Forum statistics

Threads
1,215,001
Messages
6,122,648
Members
449,092
Latest member
peppernaut

We've detected that you are using an adblocker.

We have a great community of people providing Excel help here, but the hosting costs are enormous. You can help keep this site running by allowing ads on MrExcel.com.
Allow Ads at MrExcel

Which adblocker are you using?

Disable AdBlock

Follow these easy steps to disable AdBlock

1)Click on the icon in the browser’s toolbar.
2)Click on the icon in the browser’s toolbar.
2)Click on the "Pause on this site" option.
Go back

Disable AdBlock Plus

Follow these easy steps to disable AdBlock Plus

1)Click on the icon in the browser’s toolbar.
2)Click on the toggle to disable it for "mrexcel.com".
Go back

Disable uBlock Origin

Follow these easy steps to disable uBlock Origin

1)Click on the icon in the browser’s toolbar.
2)Click on the "Power" button.
3)Click on the "Refresh" button.
Go back

Disable uBlock

Follow these easy steps to disable uBlock

1)Click on the icon in the browser’s toolbar.
2)Click on the "Power" button.
3)Click on the "Refresh" button.
Go back
Back
Top