Small Change to a Budget Template

Meagan10t

New Member
Joined
Jul 10, 2023
Messages
1
Office Version
  1. 365
Platform
  1. Windows
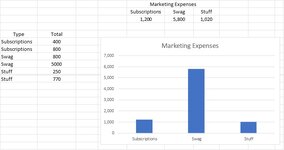
Please see the attached image for reference. I am creating a budget tracker and hoping to formulate some of these expenses to group together. In the attached example, I have subscriptions and swag expenses shown. On the pie chart that shows the total amount spent from all accounts related to the overall budget, this is perfect. However, on the table chart, this is currently showing each item that is listed below, but I would like this to group all subscriptions together, and group all swag items together, to show an overall amount for each allocated budget. Does this make sense?

1689015705058.png
 

Excel Facts

Create a chart in one keystroke
Select the data and press Alt+F1 to insert a default chart. You can change the default chart to any chart type
Hey Meagan! Other smarter folks on the list might give you a normal built-in formula or pivot table approach but I could not get it. So, I built my own formula with VBA.

VBA Code:
Option Explicit

Function SumTypes(prType, prTypesRange, prValuesRange)

    Dim rCell As Range
    
    Dim iRow As Integer
    
    For Each rCell In prTypesRange
        
        iRow = iRow + 1
    
        If rCell.Value = prType Then SumTypes = SumTypes + prValuesRange.Cells(iRow)
    
    Next rCell

End Function

That means that you'll need to convert your workbook to a macro enabled one if it is not already. Do a save as and specify macro enabled type. The code above is placed into a "code module" using the Visual Basic editor. On the menu select Developer => Visual Basic. Create a new Code Module and put the formula (code) in there.

HERE is a link to the workbook so you can see how it works.
 

Attachments

  • ResultsAmounts.jpg
    ResultsAmounts.jpg
    47 KB · Views: 2
Upvote 0
I knew that there would be a simple solution that does not require VBA. I used Excel's Sumproduct function.

AggreateCategories.xlsm
BCDEFG
1Marketing Expenses
2SubscriptionsSwagStuff
31,2005,8001,020
4
5TypeTotal
6Subscriptions400
7Subscriptions800
8Swag800
9Swag5000
10Stuff250
11Stuff770
Source
Cell Formulas
RangeFormula
E3:G3E3=SUMPRODUCT(--($B$6:$B$11=E2),$C$6:$C$11)
 
Upvote 0

Forum statistics

Threads
1,215,262
Messages
6,123,935
Members
449,134
Latest member
NickWBA

We've detected that you are using an adblocker.

We have a great community of people providing Excel help here, but the hosting costs are enormous. You can help keep this site running by allowing ads on MrExcel.com.
Allow Ads at MrExcel

Which adblocker are you using?

Disable AdBlock

Follow these easy steps to disable AdBlock

1)Click on the icon in the browser’s toolbar.
2)Click on the icon in the browser’s toolbar.
2)Click on the "Pause on this site" option.
Go back

Disable AdBlock Plus

Follow these easy steps to disable AdBlock Plus

1)Click on the icon in the browser’s toolbar.
2)Click on the toggle to disable it for "mrexcel.com".
Go back

Disable uBlock Origin

Follow these easy steps to disable uBlock Origin

1)Click on the icon in the browser’s toolbar.
2)Click on the "Power" button.
3)Click on the "Refresh" button.
Go back

Disable uBlock

Follow these easy steps to disable uBlock

1)Click on the icon in the browser’s toolbar.
2)Click on the "Power" button.
3)Click on the "Refresh" button.
Go back
Back
Top