Hi again, the best excel help in the internet! :wink:
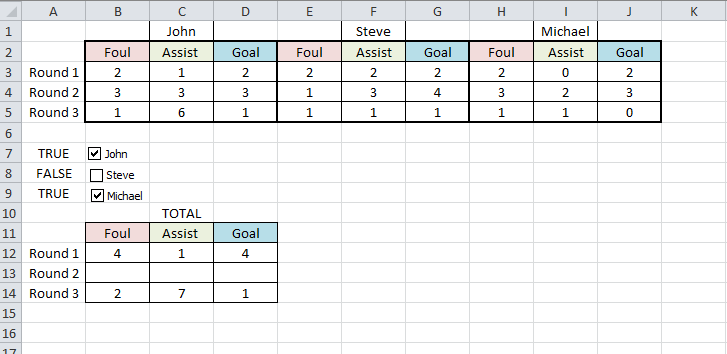
Ok on the left hand side we have statistics for different people. There are average values, sums etc.
On the right hand side we have summary of the whole group. Now I'm using boxes to decide which people to sum up to see the differences and impact.
I've tried this code =SUMPRODUCT(($A:$A=TRUE)*$C$3, $C$7, $C$11)) but apparently this command "sumproduct" works only if rows are equal, so it's impossible to decide which cells are being calculated. Is there any way please? I'm sure there is, my excel knowledge is just too limited...
Cheers
PS. In previous tread somebody adviced me to use =SUMPRODUCT(($A:$A=TRUE)*$C$3*$C$7*$C$11)) as correct code but I was receiving bad calculation. Cells in Red should give me total of 342 and it gives me 696000 instead?
If I tick first box it gives my 232000 instead of 232.
<tbody>
</tbody>
real photo:
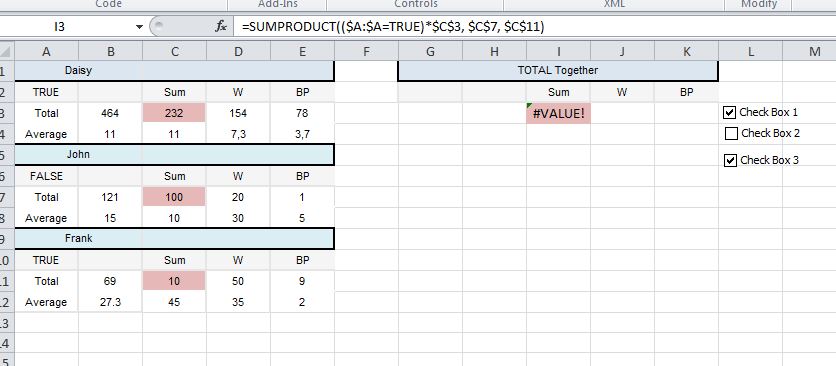
Ok on the left hand side we have statistics for different people. There are average values, sums etc.
On the right hand side we have summary of the whole group. Now I'm using boxes to decide which people to sum up to see the differences and impact.
I've tried this code =SUMPRODUCT(($A:$A=TRUE)*$C$3, $C$7, $C$11)) but apparently this command "sumproduct" works only if rows are equal, so it's impossible to decide which cells are being calculated. Is there any way please? I'm sure there is, my excel knowledge is just too limited...
Cheers
PS. In previous tread somebody adviced me to use =SUMPRODUCT(($A:$A=TRUE)*$C$3*$C$7*$C$11)) as correct code but I was receiving bad calculation. Cells in Red should give me total of 342 and it gives me 696000 instead?
If I tick first box it gives my 232000 instead of 232.
| Row\Col | A | B | C | D | E | F | G | H | I | J | K |
1 | Daisy | TOTAL Together | |||||||||
2 | FALSE | Sum | W | BP | Sum | W | BP | ||||
3 | Total | 464 | 232 | 154 | 78 | 0 | |||||
4 | Average | 11 | 11 | 7,3 | 3,7 | ||||||
5 | John | ||||||||||
6 | FALSE | Sum | W | BP | |||||||
7 | Total | 121 | 100 | 20 | 1 | ||||||
8 | Average | 15 | 10 | 30 | 5 | ||||||
9 | Frank | ||||||||||
10 | FALSE | Sum | W | BP | |||||||
11 | Total | 69 | 10 | 50 | 9 | ||||||
12 | Average | 27,3 | 45 | 35 | 2 | ||||||
13 | |||||||||||
14 |
<tbody>
</tbody>
real photo:
Last edited:
")