Target Line on graph from just 1 value

s_pochedly

New Member
Joined
Dec 6, 2023
Messages
2
Office Version
  1. 2016
Platform
  1. Windows
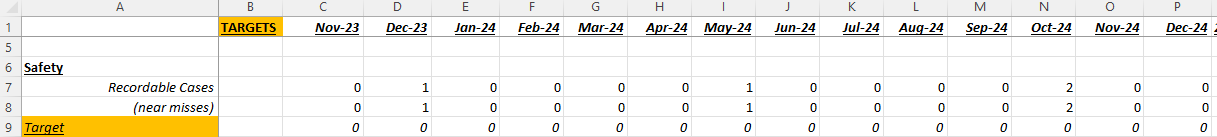
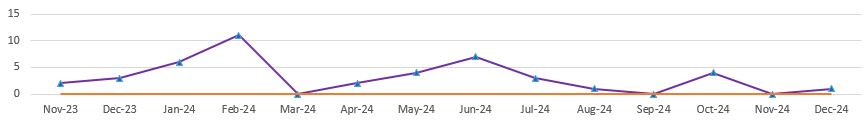
I am trying to chart out actual (performance) data points against target on a graph. Is there a way to produce the target line from just 1 value? It would be assumed all the performance variables would be put against that target. I just don't want to create another row below the performance data row, with a corresponding target for each because the target is the same for all those data points. However in graphing, Excel thinks there is only one data point for target in that series, so it only graphs that one point. I would like it to instead graph it for every performance data point, but just put the target in one cell. The reason for this is really just to streamline the data entry and compress that sheet by not having to add the helper rows.
 

Excel Facts

Who is Mr Spreadsheet?
Author John Walkenbach was Mr Spreadsheet until his retirement in June 2019.
What kind of chart? It would be very helpful is you shared some data, and possibly an image what you expect?
 
Upvote 0
It's a line graph, sorry.

first pic (SS1) depicts what I want - I would have the target for recordable cases and near misses in B7 and B8 respectively. C8:P7 would all share the goal listed in B7. Same with row 8 respectively.

2nd pic is the way I don't want to do it - adding the helper row (row 9) with a target for each month.

This section might not seem like a big deal because the target is the same for both metrics, so I technically only need 1 helper row for both those. However if you think about having multiple machines and welders, each of which we'll be measuring 5-6 different things with their own targets, that's where I'll run into having to add tons of helper rows.
---> see SS3 for a picture of this.

Finally, I'm adding image SS4 to illustrate...the orange line is target which is 0 in this example. But the point of the post is, I want to make that line based off just 1 cell, omitting the helper columns as I describe above.

Appreciate any help.
 

Attachments

  • SS1.png
    SS1.png
    10.5 KB · Views: 4
  • SS2.png
    SS2.png
    11.8 KB · Views: 5
  • SS3.png
    SS3.png
    6.2 KB · Views: 5
  • SS4.png
    SS4.png
    9.4 KB · Views: 5
Upvote 0

Forum statistics

Threads
1,215,069
Messages
6,122,959
Members
449,096
Latest member
Anshu121

We've detected that you are using an adblocker.

We have a great community of people providing Excel help here, but the hosting costs are enormous. You can help keep this site running by allowing ads on MrExcel.com.
Allow Ads at MrExcel

Which adblocker are you using?

Disable AdBlock

Follow these easy steps to disable AdBlock

1)Click on the icon in the browser’s toolbar.
2)Click on the icon in the browser’s toolbar.
2)Click on the "Pause on this site" option.
Go back

Disable AdBlock Plus

Follow these easy steps to disable AdBlock Plus

1)Click on the icon in the browser’s toolbar.
2)Click on the toggle to disable it for "mrexcel.com".
Go back

Disable uBlock Origin

Follow these easy steps to disable uBlock Origin

1)Click on the icon in the browser’s toolbar.
2)Click on the "Power" button.
3)Click on the "Refresh" button.
Go back

Disable uBlock

Follow these easy steps to disable uBlock

1)Click on the icon in the browser’s toolbar.
2)Click on the "Power" button.
3)Click on the "Refresh" button.
Go back
Back
Top