Howdy,
I'm trying to (ultimately) create a visualization in Spotfire using a range full of dates (AF2:MX100), which Spotfire doesn't care for. That's fine, I just need to count the number of unique dates per row for given two-week period. That period would be the dates specified in E1:AE1 (26 columns denoting every other week).
Luckily I'm using Excel 365 so I can use the UNIQUE function (holy smokes does that make it easier). However, Excel is not appreciating my formula, and after an embarrassingly long time searching for something to help, I'm finally asking for help.
Where AF2:MX2 is the range of dates I'd like to count distinct values for, and I'd like the distinct values to be between dates E1 and F1.
I'm trying to (ultimately) create a visualization in Spotfire using a range full of dates (AF2:MX100), which Spotfire doesn't care for. That's fine, I just need to count the number of unique dates per row for given two-week period. That period would be the dates specified in E1:AE1 (26 columns denoting every other week).
Luckily I'm using Excel 365 so I can use the UNIQUE function (holy smokes does that make it easier). However, Excel is not appreciating my formula, and after an embarrassingly long time searching for something to help, I'm finally asking for help.
Excel Formula:
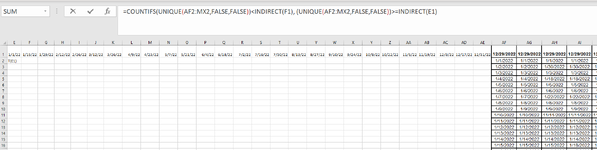
=COUNTIFS(UNIQUE(AF2:MX2,FALSE,FALSE))<INDIRECT(F1), (UNIQUE(AF2:MX2,FALSE,FALSE))>=INDIRECT(E1)Where AF2:MX2 is the range of dates I'd like to count distinct values for, and I'd like the distinct values to be between dates E1 and F1.