mezzopiano1423
New Member
- Joined
- Feb 12, 2013
- Messages
- 10
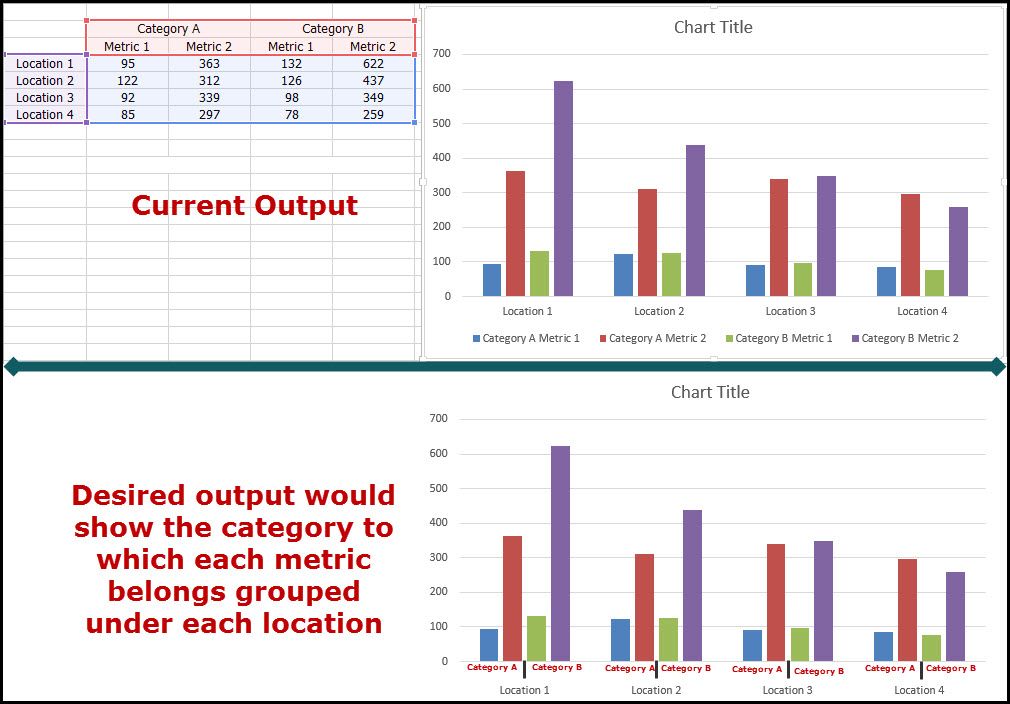
Hi folks, I am having trouble with displaying a two-level axis label.
For several locations, I am measuring two of the exact same metrics, but they fit under two categories.
I would love to group the metric Category underneath each Location, so that the user can neatly see how the two categories measure against each other, as opposed to having to refer to the chart legend.
The illustration below shows the current and desired output. Any help would be appreciated, thank you!

Last edited:


