Hi
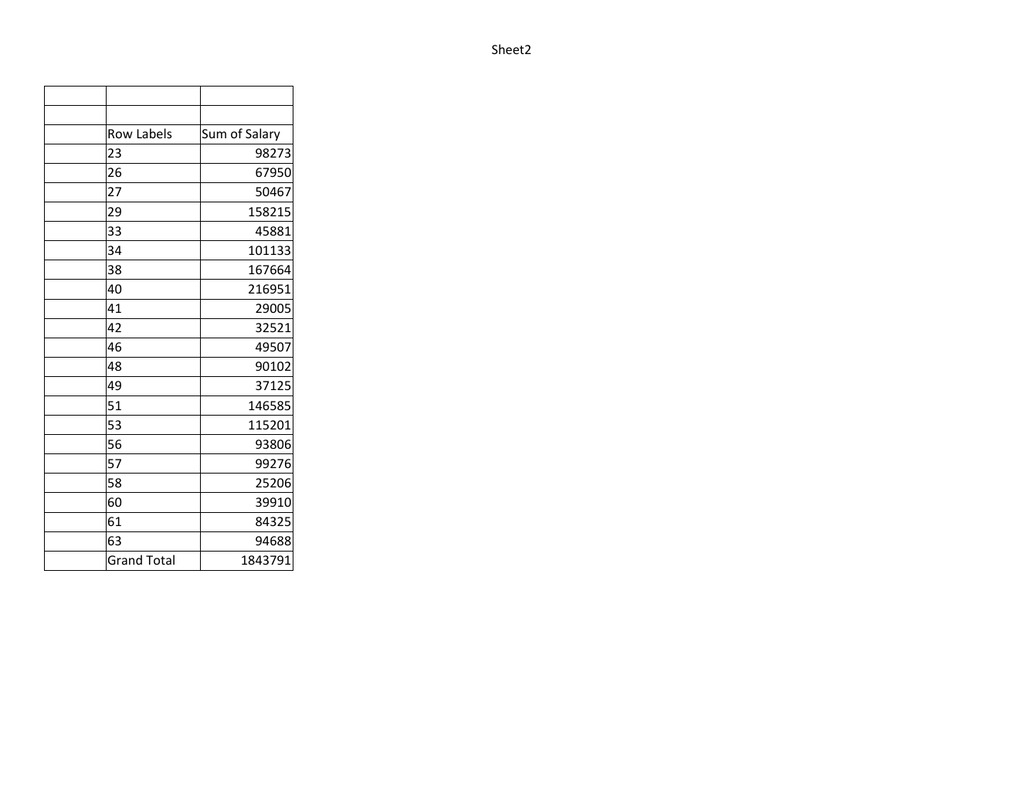
In normal Pivot Table, I can group ages but with Power Pivot it is giving me an error message, please see screenshot + the link for the original file. Thank you.

In normal Pivot Table, I can group ages but with Power Pivot it is giving me an error message, please see screenshot + the link for the original file. Thank you.
| 11111.xlsx | ||||||||||||||
|---|---|---|---|---|---|---|---|---|---|---|---|---|---|---|
| A | B | C | D | E | F | G | H | I | J | K | L | |||
| 1 | Employee ID | Location | Phone# | Salary | ID | Name | Gender | Department | Age | |||||
| 2 | 413 | New Jersey | 1-227-803-3871 | 49633 | 757 | Adina Davies | Female | Human Resources | 53 | |||||
| 3 | 749 | Idaho | 2-240-511-3733 | 35617 | 269 | Chadwick Veale | Male | Management | 41 | |||||
| 4 | 756 | California | 1-063-681-2743 | 99276 | 560 | Taylor Parker | Female | Marketing | 40 | |||||
| 5 | 362 | Arizona | 4-375-511-3060 | 40240 | 616 | Cadence Rivers | Female | Management | 61 | |||||
| 6 | 253 | Virginia | 3-001-423-6756 | 68880 | 866 | Dakota Ingram | Female | Sales | 40 | |||||
| 7 | 169 | Nebraska | 5-744-575-0520 | 101133 | 383 | Britney Bailey | Female | Accounting | 53 | |||||
| 8 | 897 | Maryland | 3-211-804-8643 | 62656 | 642 | Nathan Moore | Male | Human Resources | 49 | |||||
| 9 | 283 | Connecticut | 0-816-613-1802 | 91253 | 253 | Aiden Preston | Male | Sales | 29 | |||||
| 10 | 383 | Oregon | 2-646-560-5822 | 61551 | 607 | Alexander Robertson | Male | IT | 60 | |||||
| 11 | 962 | Oklahoma | 6-430-606-8001 | 49507 | 749 | Benny Wilcox | Male | Sales | 23 | |||||
| 12 | 642 | Rhode Island | 1-500-456-6567 | 37125 | 554 | Tom Shields | Male | R&D | 29 | |||||
| 13 | 866 | Utah | 3-624-321-7715 | 105987 | 648 | Denis Wellington | Male | IT | 56 | |||||
| 14 | 758 | Alaska | 4-471-266-5742 | 25206 | 283 | Macy Dobson | Female | Finance | 38 | |||||
| 15 | 896 | Arizona | 3-484-738-1631 | 45881 | 756 | Jack Wellington | Male | Management | 57 | |||||
| 16 | 564 | Wyoming | 1-600-105-8467 | 50467 | 852 | Tess Campbell | Female | Marketing | 38 | |||||
| 17 | 927 | Delaware | 8-363-618-8524 | 15675 | 312 | Michaela Overson | Female | Sales | 42 | |||||
| 18 | 543 | Tennessee | 1-251-243-4250 | 90102 | 897 | Mavis Murphy | Female | Operations | 23 | |||||
| 19 | 269 | Colorado | 3-426-351-1460 | 29005 | 962 | Bryon Richardson | Male | Sales | 46 | |||||
| 20 | 108 | New Mexico | 7-211-682-7447 | 96952 | 927 | Lillian Mills | Female | R&D | 40 | |||||
| 21 | 560 | Wyoming | 6-827-664-0662 | 95289 | 896 | Barry Collingwood | Male | IT | 33 | |||||
| 22 | 757 | Wyoming | 5-114-658-7802 | 53650 | 169 | Kurt Judd | Male | IT | 34 | |||||
| 23 | 552 | Michigan | 7-445-055-0810 | 94688 | 510 | Josh Griffiths | Male | Operations | 26 | |||||
| 24 | 312 | Alaska | 1-705-832-8762 | 32521 | 758 | Tom Stanton | Male | IT | 58 | |||||
| 25 | 607 | Ohio | 0-065-554-3738 | 39910 | 543 | Angelique Knight | Female | Operations | 48 | |||||
| 26 | 616 | Colorado | 6-238-711-5273 | 44085 | 552 | Elle Townend | Female | Management | 63 | |||||
| 27 | 852 | Connecticut | 4-202-514-1182 | 76411 | 564 | Johnathan Mcgee | Male | Finance | 27 | |||||
| 28 | 510 | West Virginia | 1-820-274-8361 | 67950 | 413 | Juliet Bristow | Female | Management | 51 | |||||
| 29 | 554 | Oklahoma | 8-533-107-6628 | 89335 | 108 | Mina Roberts | Female | Sales | 51 | |||||
| 30 | 648 | Arkansas | 1-888-244-2243 | 93806 | 362 | Jacqueline Reynolds | Female | Marketing | 61 | |||||
HR_1 | ||||||||||||||


