Weekly Averages

chorina13

New Member
Joined
Mar 23, 2024
Messages
15
Office Version
  1. 2021
Platform
  1. Windows
Hi,
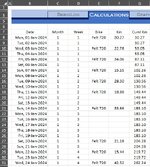
I am trying to calculate a weekly average of my bike rides done. I have attached a part copy of the area I am using but having trouble trying to isolate each week, and then count the number of rides for that and and come up with an average. Here's hoping someone can help
Thank you
Blackie
 

Attachments

  • 2024-05-01 17 50 45.jpg
    2024-05-01 17 50 45.jpg
    206.7 KB · Views: 14

Excel Facts

Best way to learn Power Query?
Read M is for (Data) Monkey book by Ken Puls and Miguel Escobar. It is the complete guide to Power Query.
Cannot manipulate data in a picture. Please re upload using XL2BB.
 
Upvote 0
@chorina13 Does this help?

Testing Formula Update.xlsm
BCDEFGHI
3TotalPer Ride
4Average km per week150.0325.67
5
6
7DateMonthWeekBikeKmCuml KmWeek KmAv Km / Ride/Wk
8Monday 1 January 202411Felt 72030.2730.27  
9Tuesday 2 January 20241130.27  
10Wednesday 3 January 202411Felt 72022.7853.05  
11Thursday 4 January 20241153.05  
12Friday 5 January 202411Felt 72034.0687.11  
13Saturday 6 January 20241187.11  
14Sunday 7 January 202411Felt 72015.15102.26102.2625.57
15Monday 8 January 202412102.26  
16Tuesday 9 January 202412Felt 72028.3130.56  
17Wednesday 10 January 202412130.56  
18Thursday 11 January 202412Felt 72018.88149.44  
19Friday 12 January 202412149.44  
20Saturday 13 January 202412149.44  
21Sunday 14 January 202412Felt 72033.66183.1157.5426.95
22Monday 15 January 202413183.1  
23Tuesday 16 January 202413183.1  
24Wednesday 17 January 202413183.1  
25Thursday 18 January 202413183.1  
26Friday 19 January 202413183.1  
27Saturday 20 January 202413Felt 72021.18204.28  
28Sunday 21 January 202413204.28151.7721.18
29Monday 22 January 202414Felt 72015.44219.72  
30Tuesday 23 January 202414219.72  
31Wednesday 24 January 202414Felt 72042.52262.24  
32Thursday 25 January 202414262.24  
33Friday 26 January 202414262.24  
34Saturday 27 January 202414262.24  
35Sunday 28 January 202414262.24188.5528.98
2018
Cell Formulas
RangeFormula
H4:I4H4=AVERAGE(H8:H35)
G8:G35G8=SUM(F$8:F8)
H8:H9H8=IF(D9<>D8,G8-SUM(I7:I$8),"")
I8:I35I8=IF(H8="","",AVERAGEIF(D$8:D8,D8,F$8:F8))
H10:H35H10=IF(D11<>D10,G10-SUM(I$8:I9),"")
 
Upvote 0
Solution
With power query
Power Query:
let
    Source = Excel.CurrentWorkbook(){[Name="Table1"]}[Content],
    #"Filtered Rows" = Table.SelectRows(Source, each ([Bike] = "Felt 720")),
    #"Grouped Rows" = Table.Group(#"Filtered Rows", {"Week"}, {{"Week Average", each List.Average([Km]), type number}})
in
    #"Grouped Rows"

Book2
IJ
5WeekWeek Average
6125.565
7226.94666667
8321.18
9428.98
Sheet1
 
Upvote 0
@chorina13 Does this help?

Testing Formula Update.xlsm
BCDEFGHI
3TotalPer Ride
4Average km per week150.0325.67
5
6
7DateMonthWeekBikeKmCuml KmWeek KmAv Km / Ride/Wk
8Monday 1 January 202411Felt 72030.2730.27  
9Tuesday 2 January 20241130.27  
10Wednesday 3 January 202411Felt 72022.7853.05  
11Thursday 4 January 20241153.05  
12Friday 5 January 202411Felt 72034.0687.11  
13Saturday 6 January 20241187.11  
14Sunday 7 January 202411Felt 72015.15102.26102.2625.57
15Monday 8 January 202412102.26  
16Tuesday 9 January 202412Felt 72028.3130.56  
17Wednesday 10 January 202412130.56  
18Thursday 11 January 202412Felt 72018.88149.44  
19Friday 12 January 202412149.44  
20Saturday 13 January 202412149.44  
21Sunday 14 January 202412Felt 72033.66183.1157.5426.95
22Monday 15 January 202413183.1  
23Tuesday 16 January 202413183.1  
24Wednesday 17 January 202413183.1  
25Thursday 18 January 202413183.1  
26Friday 19 January 202413183.1  
27Saturday 20 January 202413Felt 72021.18204.28  
28Sunday 21 January 202413204.28151.7721.18
29Monday 22 January 202414Felt 72015.44219.72  
30Tuesday 23 January 202414219.72  
31Wednesday 24 January 202414Felt 72042.52262.24  
32Thursday 25 January 202414262.24  
33Friday 26 January 202414262.24  
34Saturday 27 January 202414262.24  
35Sunday 28 January 202414262.24188.5528.98
2018
Cell Formulas
RangeFormula
H4:I4H4=AVERAGE(H8:H35)
G8:G35G8=SUM(F$8:F8)
H8:H9H8=IF(D9<>D8,G8-SUM(I7:I$8),"")
I8:I35I8=IF(H8="","",AVERAGEIF(D$8:D8,D8,F$8:F8))
H10:H35H10=IF(D11<>D10,G10-SUM(I$8:I9),"")
Hi, Thanks very much for your help, which does work, but requires a little bit mor work including have to add more columns etc. I was really hoping that the result would be only one cell formula which would be placed in my calculations box of other information I use. Thanks again.
Blackie
 
Upvote 0
With power query
Power Query:
let
    Source = Excel.CurrentWorkbook(){[Name="Table1"]}[Content],
    #"Filtered Rows" = Table.SelectRows(Source, each ([Bike] = "Felt 720")),
    #"Grouped Rows" = Table.Group(#"Filtered Rows", {"Week"}, {{"Week Average", each List.Average([Km]), type number}})
in
    #"Grouped Rows"

Book2
IJ
5WeekWeek Average
6125.565
7226.94666667
8321.18
9428.98
Sheet1
Hi,
Thanks for your response, but I am totally clueless when it comes to XL2BB and power query
Blackie
 
Upvote 0
Let me enlighten you

Power Query is a free AddIn for Excel 2010 and 2013, and is built-in functionality from Excel 2016 onwards (where it is referred to as "Get & Transform Data").

It is a powerful yet simple way of getting, changing and using data from a broad variety of sources, creating steps which may be easily repeated and refreshed. I strongly recommend learning how to use Power Query - it's among the most powerful functionalities of Excel.

- Follow this link to learn how to install Power Query in Excel 2010 / 2013.

- Follow this link for an introduction to Power Query functionality.

- Follow this link for a video which demonstrates how to use Power Query code provided.

As to XL2BB,
 
Upvote 0
Thank you Alan for trying to help. After watching the videos etc, I am even more confused than ever. I tried following the examples and instructions but nothing seems to work and I keep getting errors. or asking for something that I truly don't follow. Initially all I was after, for a simple mind like mine, and I am sure there is an answer out there, was maybe just a simple formula to give me the answer.
Thank again
 
Upvote 0
Hi, Thanks very much for your help, which does work, but requires a little bit mor work including have to add more columns etc. I was really hoping that the result would be only one cell formula which would be placed in my calculations box of other information I use. Thanks again.
Blackie
Hi Again, Sorry to be a bother, but I have entered your formulas as per instructions, but have now struck one small snag. After entering the formula in Cell I8 it calculates my average based on 7 days and not the 4 only rides for that week. Your example shows the average as 25.57 kms and mine shows 14.61kms, and so on down the column.
Sorry about this.
 
Upvote 0
1. Highlight your range of data and then click on Data, Get and Transform Data, From Range or Table.
2. With your data now in the Power Query Editor, Click on the drop down arrow in the Bike Column
3. Uncheck the Felt 720 box
4. Highlight the Week column and then select Group By from the PQ Ribbon
5. Type WeekAverage in the New Column Name Box
6. Select Average in the next field, then select the KM field
7. Select Close and Load and then select where you wish your data to go.
 
Upvote 0

Forum statistics

Threads
1,216,075
Messages
6,128,657
Members
449,462
Latest member
Chislobog

We've detected that you are using an adblocker.

We have a great community of people providing Excel help here, but the hosting costs are enormous. You can help keep this site running by allowing ads on MrExcel.com.
Allow Ads at MrExcel

Which adblocker are you using?

Disable AdBlock

Follow these easy steps to disable AdBlock

1)Click on the icon in the browser’s toolbar.
2)Click on the icon in the browser’s toolbar.
2)Click on the "Pause on this site" option.
Go back

Disable AdBlock Plus

Follow these easy steps to disable AdBlock Plus

1)Click on the icon in the browser’s toolbar.
2)Click on the toggle to disable it for "mrexcel.com".
Go back

Disable uBlock Origin

Follow these easy steps to disable uBlock Origin

1)Click on the icon in the browser’s toolbar.
2)Click on the "Power" button.
3)Click on the "Refresh" button.
Go back

Disable uBlock

Follow these easy steps to disable uBlock

1)Click on the icon in the browser’s toolbar.
2)Click on the "Power" button.
3)Click on the "Refresh" button.
Go back
Back
Top