Working on Gantt Chatt

AVIWEGATES1991

New Member
Joined
Apr 13, 2024
Messages
6
Office Version
  1. 365
Platform
  1. Windows
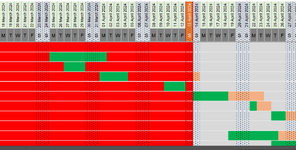
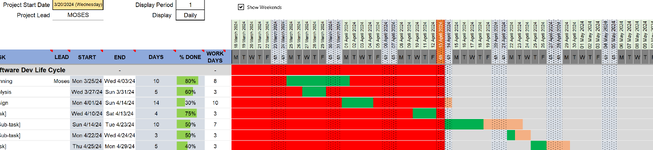
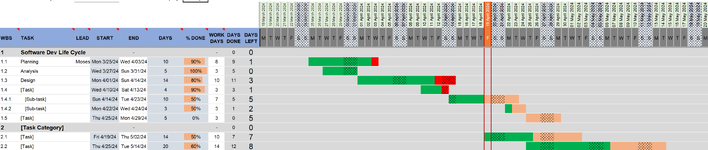
i greatly need your help with getting the OVER DUE function working and creating the Dashboard for tasks which actually reflect the info of progress and over due thats all. I tried to use some conditional formatting queries e.g AND(Progress <1,TODAY() >= end_date) which am not sure if correct but i see you used it but on my side its not working it basically highlights the whole left side RED of the working space for dates. Whereas i wanted to it on the uncompleted tasks and hence should be changing automatically without creating a check button attached are the pictures to illustrate what i mean. i noticed you do have a conditional format that has a stop but i dont know how to encorporate it with the version i downloaded as the video and the free version differ
Screenshot 2024-04-13 114854.png
 

Attachments

  • Screenshot 2024-04-13 120132.png
    Screenshot 2024-04-13 120132.png
    57.2 KB · Views: 3
  • Screenshot 2024-04-13 120640.png
    Screenshot 2024-04-13 120640.png
    154.2 KB · Views: 3

Excel Facts

Using Function Arguments with nested formulas
If writing INDEX in Func. Arguments, type MATCH(. Use the mouse to click inside MATCH in the formula bar. Dialog switches to MATCH.
Welcome to the forum. But, I'm not sure you're giving enough information? What does each line represent? How is the value "progress" determined? What is an OVER DUE function?
It may really help to provide some data the chart is based on. Mr. excel has a tool called xl2bb addin (the link is in the signature portion of this post, and also in the post editing tool bar).
If you cannot use that, post the data as a TABLE,not an image (data in images can't be copied).
 
Upvote 0
Welcome to the forum. But, I'm not sure you're giving enough information? What does each line represent? How is the value "progress" determined? What is an OVER DUE function?
It may really help to provide some data the chart is based on. Mr. excel has a tool called xl2bb addin (the link is in the signature portion of this post, and also in the post editing tool bar).
If you cannot use that, post the data as a TABLE,not an image (data in images can't be copied).
Thanks a lot for your at-most response i really do appreciate it. After a lot of series of tries i managed to get it working. Wanted to ask is it possible to give me guidelines on how to format a Doughnut graph for only each single task lets say Planning if you notice the progress is 90% and its already past due date for completion so on the doughnut it should show two colors red as 10% and Green as 90%. Then for task 2.1 it should show 50% green and 50% orange. Then for task 1.5 it should only show orange to show progress as 0%, the emphasis here is that if its over due it should automatically change to red the uncompleted percentage. is it possible or achievable your help will be highly appreciated.
 

Attachments

  • Screenshot 2024-04-19 031521.png
    Screenshot 2024-04-19 031521.png
    127.9 KB · Views: 3
Upvote 0
In future please do not mark a post as the solution when it does not contain one. Thanks
 
Upvote 0

Forum statistics

Threads
1,215,202
Messages
6,123,625
Members
449,109
Latest member
Sebas8956

We've detected that you are using an adblocker.

We have a great community of people providing Excel help here, but the hosting costs are enormous. You can help keep this site running by allowing ads on MrExcel.com.
Allow Ads at MrExcel

Which adblocker are you using?

Disable AdBlock

Follow these easy steps to disable AdBlock

1)Click on the icon in the browser’s toolbar.
2)Click on the icon in the browser’s toolbar.
2)Click on the "Pause on this site" option.
Go back

Disable AdBlock Plus

Follow these easy steps to disable AdBlock Plus

1)Click on the icon in the browser’s toolbar.
2)Click on the toggle to disable it for "mrexcel.com".
Go back

Disable uBlock Origin

Follow these easy steps to disable uBlock Origin

1)Click on the icon in the browser’s toolbar.
2)Click on the "Power" button.
3)Click on the "Refresh" button.
Go back

Disable uBlock

Follow these easy steps to disable uBlock

1)Click on the icon in the browser’s toolbar.
2)Click on the "Power" button.
3)Click on the "Refresh" button.
Go back
Back
Top