Hello
I have a data like this:
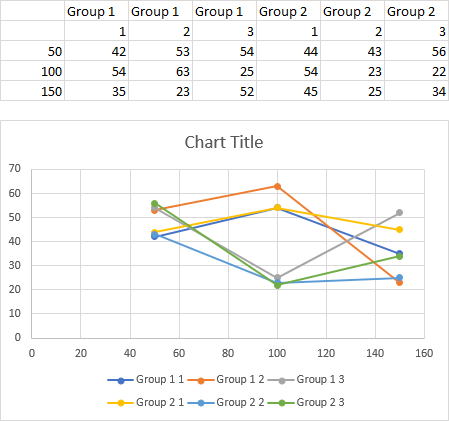
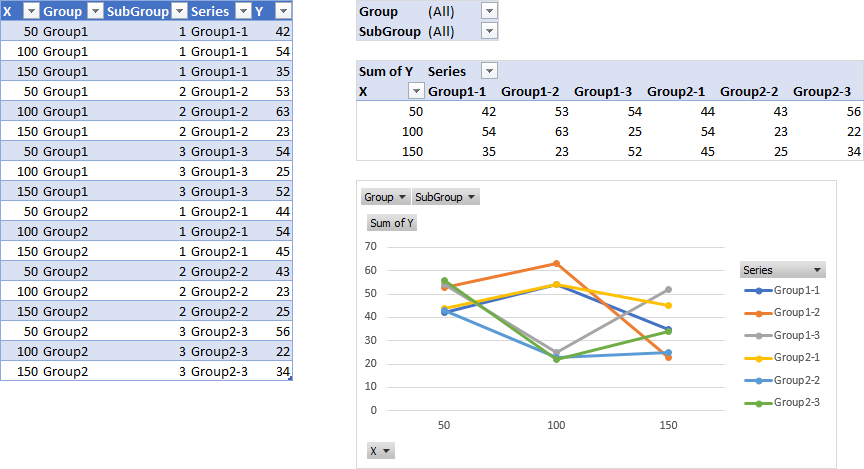
Group 1
1 2 3
50 42 53 54
100 54 63 25
150 35 23 52
Group 2
1 2 3
50 44 43 56
100 54 23 22
150 45 25 34
etc
I want to plot in one graph the lines:
Group1-1
Group1-2
Group1-3
Group2-1
Group2-2
Group2-3
all versus 50,100,150
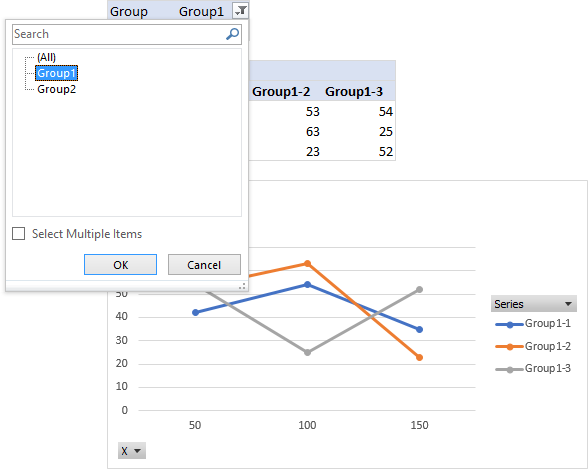
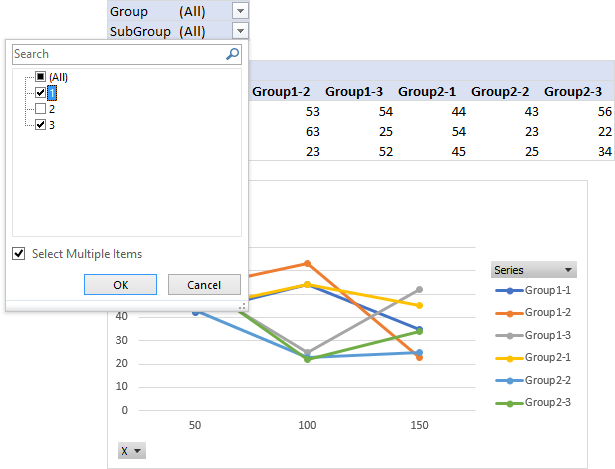
How can I do this please instead of manually adding each line? They are so many it will take too much time.
Thanks!
I have a data like this:
Group 1
1 2 3
50 42 53 54
100 54 63 25
150 35 23 52
Group 2
1 2 3
50 44 43 56
100 54 23 22
150 45 25 34
etc
I want to plot in one graph the lines:
Group1-1
Group1-2
Group1-3
Group2-1
Group2-2
Group2-3
all versus 50,100,150
How can I do this please instead of manually adding each line? They are so many it will take too much time.
Thanks!