Finding all possible combinations of 2 sums

togenmoser

New Member
Joined
Mar 21, 2024
Messages
19
Office Version
  1. 2016
Platform
  1. Windows
Hello everyone, I need some help here please.
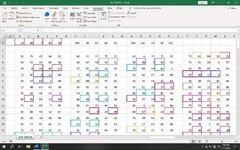
Using vba macro, I want excel to find all possible combinations of 2 cells sum from each row of 5 cells that sum up to any of the target values of cells h1:r1.
And then set all-round thick border for all 2 cells that sum up to any of the target values.
And also set same border colour for cells that sum up to the same target value.
My worksheet has multiple rows and each row has 5 cells. Rows are separated by an empty cell.
I used the find sum pairs but excel keeps skipping some of the cells that has sum total equal to a target value.
Eg. Cells d33 and e33 has sum total of 83 but excel ignored it.
Any effort will be much appreciated.
Thanks.

DLF FORECAST.xlsm
ABCDEFGHIJKLMNOPQRSTUVWXY
1826355146914513796151118771326912483
2
3267541648348513771216347075257241845225
454532960563987325351302015672754128937
529634902147823716422619446144375901164
6726461950469434482212271889303617864
7403769760201073441241744331823628908756
81288656370598571529035113624426914123516
9316644184542619377580761185666379514753
109085621049846979186855771979706965152426
1172128058558812560838134910867053853043
1235164519174764625608387623688141906545
132015183859216916373379709041406566633868
1464778166375161365513657636816312016142
157277803761568573683939542575602036498830
16114378690688866572673722356635829267689
1715874070837944384230894325823433685082
186576785722675268412761122514903418585521
19192784412222324301581478738522945618
2059237262552316434795659921466850452815
217154202475157017771642434170682963263317
22534781510378633351129627049412514841051
2317317067752686123913630345019171078507
24505574588125891946371735128063327511780
251786731121617627658799013543273217043
2637905785915404589827249905377480681310
276226673359827313525144666082695660544145
28498043155512015163231125637685918122861
29486375884132875771804336805735881524361
307570465526592423454943238646354518048
315621827616642654415746846557824668811
32783113114565759141235458939783829273319
338582156870206165638265117225277937363473
SUN. SPECIAL
Cell Formulas
RangeFormula
H1H1=SUM(B1,C1)
I1I1=SUM(B1,D1)
J1J1=SUM(B1,E1)
K1K1=SUM(B1,F1)
L1L1=SUM(C1,D1)
N1N1=SUM(C1,E1)
O1O1=SUM(C1,F1)
P1P1=SUM(D1,E1)
Q1Q1=SUM(D1,F1)
R1R1=SUM(E1,F1)
Named Ranges
NameRefers ToCells
'SUN. SPECIAL'!Print_Area='SUN. SPECIAL'!$C$1:$BC$106N1:O1, L1, H1
 

Excel Facts

Workdays for a market open Mon, Wed, Friday?
Yes! Use "0101011" for the weekend argument in NETWORKDAYS.INTL or WORKDAY.INTL. The 7 digits start on Monday. 1 means it is a weekend.
1) Make sure the values are there exactly as you see, not just formatted to show that way.
Have you checked?:
Excel Formula:
=D33+E33-R1=0

2) show us the code - may be it is a problem with code.
 
Upvote 0
Here is the code I used. Cells h1:r1 are the target values.

Sub FindAllSumPairs()
'Declare variables
Dim ws As Worksheet
Dim rng As Range
Dim cell As Range
Dim cell2 As Range
Dim i As Long, j As Long, k As Long, m As Long
Dim sum As Long
Dim color As Long

'Set worksheet and range
Set ws = ActiveSheet
Set rng = ws.UsedRange 'Change this as needed

'Loop through the target values in H1 to Q1
For i = 8 To 17
'Get the target value and a random color
sum = ws.Cells(1, i).Value
color = RGB(Int(Rnd * 256), Int(Rnd * 256), Int(Rnd * 256))
'Check if the chosen color is too close to the previous color
If i > 7 Then
'Get the previous color
prevColor = ws.Cells(1, i - 1).Interior.color

'Calculate the difference between the two colors using Euclidean distance formula
diff = Sqr(((color Mod 256) - (prevColor Mod 256)) ^ 2 + ((color \ 256 Mod 256) - (prevColor \ 256 Mod 256)) ^ 2 + ((color \ 65536) - (prevColor \ 65536)) ^ 2)

'If the difference is less than a threshold, choose a different color
If diff < 50 Then 'Change this as needed
color = RGB(Int(Rnd * 256), Int(Rnd * 256), Int(Rnd * 256))
End If

End If

'Loop through the rows in the range
For j = 1 To rng.Rows.Count
'Loop through the sets of 5 cells in the same row, separated by empty cells
For m = 1 To rng.Columns.Count Step 6
'Loop through the columns in the same set of 5 cells
For k = m To m + 4
'Loop through the remaining columns in the same set of 5 cells
For l = k + 1 To m + 4
'Check if the current cell and another cell are not empty and add up to the target value
If Not IsEmpty(rng.Cells(j, k)) And Not IsEmpty(rng.Cells(j, l)) And rng.Cells(j, k).Value + rng.Cells(j, l).Value = sum Then
'Set the border color and thickness for the pair of cells, using all round borders
With rng.Cells(j, k).Borders(xlEdgeLeft)
.LineStyle = xlContinuous
.color = color
.Weight = xlThick
End With

With rng.Cells(j, k).Borders(xlEdgeRight)
.LineStyle = xlContinuous
.color = color
.Weight = xlThick
End With

With rng.Cells(j, l).Borders(xlEdgeLeft)
.LineStyle = xlContinuous
.color = color
.Weight = xlThick
End With

With rng.Cells(j, l).Borders(xlEdgeRight)
.LineStyle = xlContinuous
.color = color
.Weight = xlThick
End With

With rng.Cells(j, k).Borders(xlEdgeTop)
.LineStyle = xlContinuous
.color = color
.Weight = xlThick
End With

With rng.Cells(j, k).Borders(xlEdgeBottom)
.LineStyle = xlContinuous
.color = color
.Weight = xlThick
End With

With rng.Cells(j, l).Borders(xlEdgeTop)
.LineStyle = xlContinuous
.color = color
.Weight = xlThick
End With

With rng.Cells(j, l).Borders(xlEdgeBottom)
.LineStyle = xlContinuous
.color = color
.Weight = xlThick
End With

'Do not exit the inner loop to find all the pairs

End If

Next l

Next k

Next m

Next j

Next i

End Sub
 
Upvote 0
I changed the code and it got worse. It wouldn't even do anything in the worksheet.
Here's the second code I tired ;


Sub FindMatchingCombinationsInRows()
Dim ws As Worksheet
Set ws = ActiveSheet

Dim lastRow As Long
lastRow = ws.Cells(ws.Rows.Count, "A").End(xlUp).Row

Dim row As Long
Dim i As Integer, j As Integer, k As Integer
Dim sum As Double
Dim cellValue As Double
Dim combinationsRange As Range, compareRange As Range
Dim rng As Range

' Set the range for comparison (H1:R1)
Set compareRange = ws.Range("H1:R1")

' Loop through each row with data
For row = 1 To lastRow Step 2 ' Step 2 accounts for the empty row between data rows
' Set the range for the combinations (5 cells in the current row)
Set combinationsRange = ws.Range(ws.Cells(row, 1), ws.Cells(row, 5))

' Loop through each cell in the combinations range
For i = 1 To combinationsRange.Cells.Count
For j = i + 1 To combinationsRange.Cells.Count
' Calculate the sum of the two cells
sum = combinationsRange.Cells(i).Value + combinationsRange.Cells(j).Value

' Compare the sum with each cell in the compare range
For k = 1 To compareRange.Cells.Count
cellValue = compareRange.Cells(k).Value
' If a match is found, apply a thick border with a random color
If sum = cellValue Then
Set rng = Union(combinationsRange.Cells(i), combinationsRange.Cells(j))
' Apply a thick border with a random color to the matching combination
ApplyRandomColorBorder rng
' No need to exit the loop as we want to check all possible matches
End If
Next k
Next j
Next i
Next row
End Sub

Sub ApplyRandomColorBorder(rng As Range)
Dim border As Variant
For Each border In rng.Borders
With border
.LineStyle = xlContinuous
.ColorIndex = Int((56 - 1 + 1) * Rnd + 1) ' Random color index between 1 and 56
.Weight =
xlThick
End With
Next border
End Sub
 
Upvote 0
1) Make sure the values are there exactly as you see, not just formatted to show that way.
Have you checked?:
Excel Formula:
=D33+E33-R1=0

2) show us the code - may be it is a problem with code.
I want excel to find all possible two cells in all rows that when sum up equals any of the cells h1:r1.
 
Upvote 0
as for this part:
=D33+E33-R1=0
I want excel to find all possible two cells in all rows that when sum up equals any of the cells h1:r1.
Sure, the code is for whole worksheet (had no time yet to read and analyze it). But you expected a specific sum in these particular cells, while it may be it only looks the proper way, and is not equal. Try writing in A1:A100 100 times 0.1 and then in B1 write
Excel Formula:
=100-sum(A1:A100)
one would expect 0 as a result and it is not! (because of problems with representation of decimal fractions in binary system and limited precision of calculations).

So did you try in your worksheet
=D33+E33-R1=0
?
 
Upvote 0
W
as for this part:

Sure, the code is for whole worksheet (had no time yet to read and analyze it). But you expected a specific sum in these particular cells, while it may be it only looks the proper way, and is not equal. Try writing in A1:A100 100 times 0.1 and then in B1 write
Excel Formula:
=100-sum(A1:A100)
one would expect 0 as a result and it is not! (because of problems with representation of decimal fractions in binary system and limited precision of calculations).

So did you try in your worksheet
=D33+E33-R1=0
?
With the exception of cells in the 1 columns, the rest are populated data.
Cell B1:F1 contains current data. Whiles cells h1:r1 are the possible combinations of 2 cells of cells B1:F1.
Now I want excel to loop through the populated data in the rest of the worksheet and in all the rows to find all two cells in each row that sum up to any of r1:h1
 
Upvote 0
W

With the exception of cells in the 1 columns, the rest are populated data.
Cell B1:F1 contains current data. Whiles cells h1:r1 are the possible combinations of 2 cells of cells B1:F1.
Now I want excel to loop through the populated data in the rest of the worksheet and in all the rows to find all two cells in each row that sum up to any of r1:h1
If the sun data of any two cells in the same row equals any of the cells in h1:r1, excel should set all round border colour to the two cells. Cells matching the same target value should have same all round border colour.
I've attached a screenshot of how it looks like the code is run.
 

Attachments

  • DLF SAMPLE.jpg
    DLF SAMPLE.jpg
    126.6 KB · Views: 6
Upvote 0
Before we start code fighting - have you tried my suggestion from post #6:

Did you try in your worksheet
Excel Formula:
=D33+E33-R1=0

It really could be the reason! But you left my question without answer.


Anyway, I went through the code and the real reason is (even commented in macro):

VBA Code:
'Loop through the target values in H1 to Q1
For i = 8 To 17

While you mentioned in description (post #1):
the target values of cells h1:r1.

So this line(s) (change in the comment is optional, but highly recommended) shall read:

VBA Code:
'Loop through the target values in H1 to R1
For i = 8 To 18

Have a good weekend!
 
Upvote 1
Solution
Before we start code fighting - have you tried my suggestion from post #6:

Did you try in your worksheet
Excel Formula:
=D33+E33-R1=0

It really could be the reason! But you left my question without answer.


Anyway, I went through the code and the real reason is (even commented in macro):

VBA Code:
'Loop through the target values in H1 to Q1
For i = 8 To 17

While you mentioned in description (post #1):


So this line(s) (change in the comment is optional, but highly recommended) shall read:

VBA Code:
'Loop through the target values in H1 to R1
For i = 8 To 18

Have a good weekend!
Sorry sir, I tried your suggestion and the answer is 0 as you said.
Oh yeah!!! Thanks so much!!! I'll correct it and try it.
Thanks so much. You have no idea how helpful you've been to me. 😊
 
Upvote 0

Forum statistics

Threads
1,215,071
Messages
6,122,964
Members
449,094
Latest member
Anshu121

We've detected that you are using an adblocker.

We have a great community of people providing Excel help here, but the hosting costs are enormous. You can help keep this site running by allowing ads on MrExcel.com.
Allow Ads at MrExcel

Which adblocker are you using?

Disable AdBlock

Follow these easy steps to disable AdBlock

1)Click on the icon in the browser’s toolbar.
2)Click on the icon in the browser’s toolbar.
2)Click on the "Pause on this site" option.
Go back

Disable AdBlock Plus

Follow these easy steps to disable AdBlock Plus

1)Click on the icon in the browser’s toolbar.
2)Click on the toggle to disable it for "mrexcel.com".
Go back

Disable uBlock Origin

Follow these easy steps to disable uBlock Origin

1)Click on the icon in the browser’s toolbar.
2)Click on the "Power" button.
3)Click on the "Refresh" button.
Go back

Disable uBlock

Follow these easy steps to disable uBlock

1)Click on the icon in the browser’s toolbar.
2)Click on the "Power" button.
3)Click on the "Refresh" button.
Go back
Back
Top