Single Custom X-Axis Label (Date) in Excel Chart

sam007

New Member
Joined
Jun 12, 2020
Messages
2
Office Version
  1. 365
Platform
  1. Windows
I'm trying to edit a single label on the X-axis of my Excel chart. I have a simple time series chart with date labels on the x-axis. I have chosen a single letter for the month. I want to edit the first month of the year (J) only and change it to 2020. The next label should remain F.

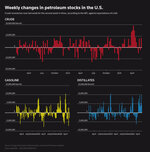
I attached a screenshot of what the X-axis labels should look like. With one label the year and the rest of the labels the month.
 

Attachments

  • Template.jpg
    Template.jpg
    201.3 KB · Views: 35

Excel Facts

What do {} around a formula in the formula bar mean?
{Formula} means the formula was entered using Ctrl+Shift+Enter signifying an old-style array formula.

Forum statistics

Threads
1,216,153
Messages
6,129,176
Members
449,491
Latest member
maxim_sivakon

We've detected that you are using an adblocker.

We have a great community of people providing Excel help here, but the hosting costs are enormous. You can help keep this site running by allowing ads on MrExcel.com.
Allow Ads at MrExcel

Which adblocker are you using?

Disable AdBlock

Follow these easy steps to disable AdBlock

1)Click on the icon in the browser’s toolbar.
2)Click on the icon in the browser’s toolbar.
2)Click on the "Pause on this site" option.
Go back

Disable AdBlock Plus

Follow these easy steps to disable AdBlock Plus

1)Click on the icon in the browser’s toolbar.
2)Click on the toggle to disable it for "mrexcel.com".
Go back

Disable uBlock Origin

Follow these easy steps to disable uBlock Origin

1)Click on the icon in the browser’s toolbar.
2)Click on the "Power" button.
3)Click on the "Refresh" button.
Go back

Disable uBlock

Follow these easy steps to disable uBlock

1)Click on the icon in the browser’s toolbar.
2)Click on the "Power" button.
3)Click on the "Refresh" button.
Go back
Back
Top