Automated Chart and Ranges

hananak

Board Regular
Joined
Feb 10, 2022
Messages
69
Office Version
  1. 365
  2. 2016
Platform
  1. Windows
Dear All,

I really need help, I have checked on internet but can't seems to find an answer for my problem.

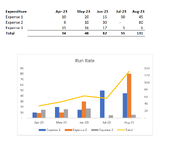
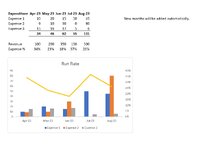
Basically I am looking for formulas where new Expense category will be added (not that frequently) in rows and in the columns new months will be added and a graphs will be linked to the data to show the run rate.

What I want is that the Graphs to be automatically updated based on the new information available (Expense Category and Months).

I would really appreciate your help.

Please see the attached picture for better understanding of the layout of the data.

Thanks in advance for your kind help.
 

Attachments

  • Dynamic Chart Range.PNG
    Dynamic Chart Range.PNG
    29.8 KB · Views: 9

Excel Facts

Quick Sum
Select a range of cells. The total appears in bottom right of Excel screen. Right-click total to add Max, Min, Count, Average.
What is a scenario of change? A new month, a new category, or both?

And can you paste (not an image, please) some of the raw data that makes up your data for the pivot?
 
Upvote 0
What is a scenario of change? A new month, a new category, or both?

And can you paste (not an image, please) some of the raw data that makes up your data for the pivot?
Hi,

Thanks for your reply. The scenario is new month and not that often but new expense category as well. I have revised little bit and now there is a secondary axis for expense %. I have uploaded the picture, so it was to understand the final result.

Formula Required.xlsx
DEFGHIJKLMNOPQR
2
3
4ExpenditureApr-23May-23Jun-23Jul-23Aug-23
5Expense 11020155045New months will be added automatically.
6Expense 291030080
7Expense 315161756
834466255131
9
10Revenue100200350150500
11Expense %34%23%18%37%26%
12
13
14
15
16
17
18
19
20
21
22
23
24
25
26
27
28
29
Sheet1
Cell Formulas
RangeFormula
E8:I8E8=SUM(E5:E7)
E11:I11E11=E8/E10
 

Attachments

  • 1.jpg
    1.jpg
    85 KB · Views: 5
Upvote 0
Okay, So to make the scenario data more complete I created a source data group in a TABLE.
This answers your first question. I'm still thinking on how to calculate the percentage of expenses compared to revenue question. But, it seems to me you may need to use Power Pivot or Power Query to create a measure for that, and then add a secondary axis. I am not proficient at measures.

Mr excel questions 60.xlsm
DEF
13
14My Guess as to SOURCE DATA
15Expense TypeDateAmount
16Expense 12023-Apr4
17Expense 22023-May5
18Expense 22023-Jun4
19Expense 22023-Jul4
20Expense 12023-Aug1
21Expense 32023-Apr2
22Expense 12023-May5
23Expense 12023-Jun3
24Expense 32023-Jul5
25Expense 32023-Aug3
26Expense 12023-Apr2
27Expense 32023-May4
28Expense 32023-Jun3
29Expense 32023-Jul1
30Expense 22023-Aug3
31Expense 12023-Apr3
32Expense 12023-May5
33Expense 22023-Jun3
34Expense 12023-Jul3
35Expense 22023-Aug5
36Expense 22023-Apr1
37Expense 32023-May1
38Expense 32023-Jun4
39Expense 22023-Jul4
40Expense 32023-Aug5
41Expense 22023-Apr3
42Expense 22023-May4
43Expense 22023-Jun4
44Expense 32023-Jul5
45Expense 22023-Aug3
46Expense 22023-Apr1
47Expense 12023-May1
48Expense 32023-Jun2
49Expense 32023-Jul2
50Expense 32023-Aug4
51Expense 22023-Apr3
52Expense 12023-May1
53Expense 12023-Jun5
54Expense 12023-Jul1
55Expense 12023-Aug4
56Expense 12023-Apr5
57Expense 22023-May5
58Expense 32023-Jun3
59Expense 12023-Jul3
60Expense 32023-Aug1
61Expense 12023-Apr1
62Expense 32023-May2
63Expense 12023-Jun2
64Expense 12023-Jul5
65Expense 12023-Aug2
Sheet5


I used this table to create a pivot chart. Pivot charts do not copy with the xl2bb add in.
And when creating a pivot chart a pivot table is automatically created.


1695020268326.png


Because there is a table, additional records can be added that will automatically update your pivot chart.

Mr excel questions 60.xlsm
DEF
15Expense TypeDateAmount
16Expense 12023-Apr4
17Expense 22023-May5
18Expense 22023-Jun4
19Expense 22023-Jul4
20Expense 12023-Aug1
21Expense 32023-Apr2
22Expense 12023-May5
23Expense 12023-Jun3
24Expense 32023-Jul5
25Expense 32023-Aug3
26Expense 12023-Apr2
27Expense 32023-May4
28Expense 32023-Jun3
29Expense 32023-Jul1
30Expense 22023-Aug3
31Expense 12023-Apr3
32Expense 12023-May5
33Expense 22023-Jun3
34Expense 12023-Jul3
35Expense 22023-Aug5
36Expense 22023-Apr1
37Expense 32023-May1
38Expense 32023-Jun4
39Expense 22023-Jul4
40Expense 32023-Aug5
41Expense 22023-Apr3
42Expense 22023-May4
43Expense 22023-Jun4
44Expense 32023-Jul5
45Expense 22023-Aug3
46Expense 22023-Apr1
47Expense 12023-May1
48Expense 32023-Jun2
49Expense 32023-Jul2
50Expense 32023-Aug4
51Expense 22023-Apr3
52Expense 12023-May1
53Expense 12023-Jun5
54Expense 12023-Jul1
55Expense 12023-Aug4
56Expense 12023-Apr5
57Expense 22023-May5
58Expense 32023-Jun3
59Expense 12023-Jul3
60Expense 32023-Aug1
61Expense 12023-Apr1
62Expense 32023-May2
63Expense 12023-Jun2
64Expense 12023-Jul5
65Expense 12023-Aug2
66Expense 42023-Sep10
Sheet5


Clicking REFRESH the chart automatically updates:

1695020408067.png


The key is using tables. You can probably do this using range references but you would need to update your range with every new month and or new expense.
 
Upvote 0

Forum statistics

Threads
1,215,111
Messages
6,123,155
Members
449,098
Latest member
Doanvanhieu

We've detected that you are using an adblocker.

We have a great community of people providing Excel help here, but the hosting costs are enormous. You can help keep this site running by allowing ads on MrExcel.com.
Allow Ads at MrExcel

Which adblocker are you using?

Disable AdBlock

Follow these easy steps to disable AdBlock

1)Click on the icon in the browser’s toolbar.
2)Click on the icon in the browser’s toolbar.
2)Click on the "Pause on this site" option.
Go back

Disable AdBlock Plus

Follow these easy steps to disable AdBlock Plus

1)Click on the icon in the browser’s toolbar.
2)Click on the toggle to disable it for "mrexcel.com".
Go back

Disable uBlock Origin

Follow these easy steps to disable uBlock Origin

1)Click on the icon in the browser’s toolbar.
2)Click on the "Power" button.
3)Click on the "Refresh" button.
Go back

Disable uBlock

Follow these easy steps to disable uBlock

1)Click on the icon in the browser’s toolbar.
2)Click on the "Power" button.
3)Click on the "Refresh" button.
Go back
Back
Top