Calculate 3 Year Standard Deviation using Monthly & Quarterly returns

NewEnglandMade

New Member
Joined
Nov 19, 2021
Messages
2
Office Version
  1. 2019
Platform
  1. Windows
Good Evening All,

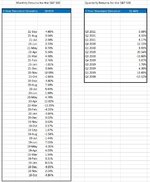
I have been able to successfully calculate the 3 Year Standard Deviation for the S&P 500 using monthly data. The figure I obtain coincides with outside data vendors and I assume is correct. When I attempt to calculate the 3 Year Standard Deviation on the same Index, over the same time period, only using quarterly data, I get a different number. is there a way to adjust so the numbers coincide?

I have attached a spreadsheet with data for both monthly (36 months) and quarterly (12 quarters)

Looking for a way to get the same figure for the 3 Year Standard Deviation

Thanks

Doug
 

Attachments

  • 3Yr SD.JPG
    3Yr SD.JPG
    87.6 KB · Views: 530

Excel Facts

Whats the difference between CONCAT and CONCATENATE?
The newer CONCAT function can reference a range of cells. =CONCATENATE(A1,A2,A3,A4,A5) becomes =CONCAT(A1:A5)
Welcome to the Forum!

You just need to be clear what it is that you're calculating.

18.81% looks to me like an annualised SD of your monthly returns, i.e. SQRT(12)*STDDEV.S(MonthlyReturnVector)

You might want to quote the investment returns over a different period, e.g. quarterly, six-monthly, or annually.

But if you want the (annualised) SD of monthly returns, you necessarily need to use monthly returns in this calculation.

If you use quarterly returns then you'd be calculating the SD of quarterly returns, like comparing apples and oranges.
 
Upvote 0
Agreeed, the second column is the quarterly return data. What I am trying to accomplish is getting the annualized SD calculated with quarterly data to match the annualized SD calculated with monthly data.
What I have been doing is calculating quarterly SD *SQRT (4). Some say use 3 as range is over 3 years. Maybe something that can not be accomplished?
Thanks
 
Upvote 0
You're correct in using Quarterly SD x SQRT(4). It's based on the convention that annualised variance = 12 x variance of monthly returns, or 4 x variance of quarterly returns etc. (The fact that you're calculating over N years - where N is 3 in this case - doesn't come into it).

Over your three year measurement period, you've calculated:

Annualised variance of monthly returns = 18.81%
Annualised variance of quarterly returns = 22.46%

There's no adjustment to be made to bring these into line - you're measuring two different things.

Hence my comment about apples and oranges. If you're comparing the volatility of particular stocks or other investment alternatives, say, to this S&P dataset, you need to be using the same measuring stick for the comparison to be valid.
 
Upvote 0
Solution

Forum statistics

Threads
1,214,985
Messages
6,122,602
Members
449,089
Latest member
Motoracer88

We've detected that you are using an adblocker.

We have a great community of people providing Excel help here, but the hosting costs are enormous. You can help keep this site running by allowing ads on MrExcel.com.
Allow Ads at MrExcel

Which adblocker are you using?

Disable AdBlock

Follow these easy steps to disable AdBlock

1)Click on the icon in the browser’s toolbar.
2)Click on the icon in the browser’s toolbar.
2)Click on the "Pause on this site" option.
Go back

Disable AdBlock Plus

Follow these easy steps to disable AdBlock Plus

1)Click on the icon in the browser’s toolbar.
2)Click on the toggle to disable it for "mrexcel.com".
Go back

Disable uBlock Origin

Follow these easy steps to disable uBlock Origin

1)Click on the icon in the browser’s toolbar.
2)Click on the "Power" button.
3)Click on the "Refresh" button.
Go back

Disable uBlock

Follow these easy steps to disable uBlock

1)Click on the icon in the browser’s toolbar.
2)Click on the "Power" button.
3)Click on the "Refresh" button.
Go back
Back
Top