Pearl_022
New Member
- Joined
- Jan 21, 2021
- Messages
- 22
- Office Version
- 365
- 2016
- 2013
- 2010
- Platform
- Windows
- MacOS
HI All,
Need help in creating formulas for QTD & YTD based on a criteria.
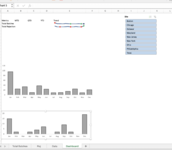
Need a formula for calculating QTD & YTD in below output table based on data table for both TotalBatches and TotalRejection.
Please help me creating calculation.
Data Table
(In my data table I have 12 months of data with multiple same dates)
Thanks in advance.
Need help in creating formulas for QTD & YTD based on a criteria.
Need a formula for calculating QTD & YTD in below output table based on data table for both TotalBatches and TotalRejection.
Please help me creating calculation.
Data Table
(In my data table I have 12 months of data with multiple same dates)
| Site | Date | Month | Year | Totalbatches | TotalRejection |
| Texas | 1/1/2019 | 1 | 2019 | 4 | 0 |
| Boston | 1/1/2019 | 1 | 2019 | 198 | 4 |
| Chicago | 2/1/2019 | 2 | 2019 | 90 | 7 |
| New Jersey | 2/1/2019 | 2 | 2019 | 254 | 5 |
| New York | 3/1/2019 | 3 | 2019 | 567 | 3 |
| Philadelphia | 3/1/2019 | 3 | 2019 | 87 | 0 |
| Maryland | 4/1/2019 | 4 | 2019 | 79 | 2 |
| Delawar | 4/2/2019 | 4 | 2019 | 90 | 0 |
| Texas | 1/1/2020 | 1 | 2020 | 4 | 0 |
| Boston | 1/1/2020 | 1 | 2020 | 3 | 0 |
| Chicago | 2/1/2020 | 2 | 2020 | 7 | 2 |
| New Jersey | 2/1/2020 | 2 | 2020 | 8 | 3 |
| New York | 3/1/2020 | 3 | 2020 | 54 | 1 |
| Philadelphia | 3/1/2020 | 3 | 2020 | 60 | 5 |
Thanks in advance.